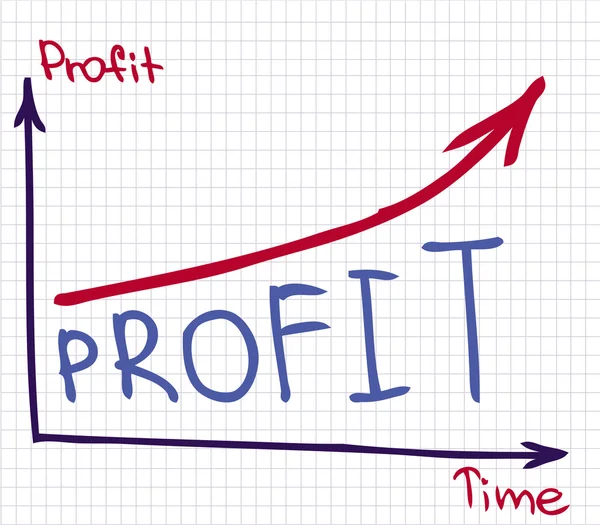
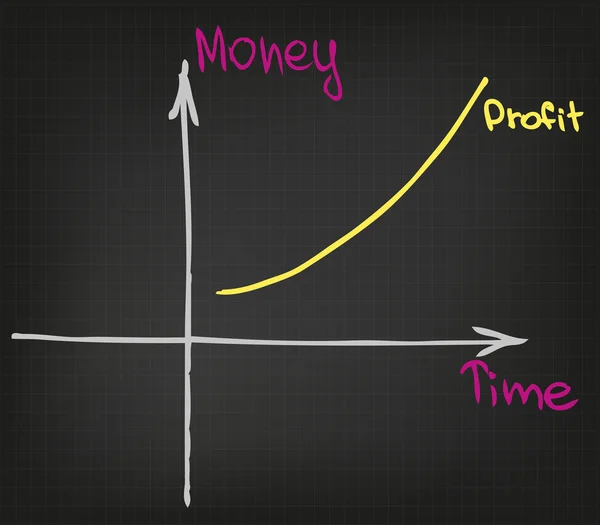
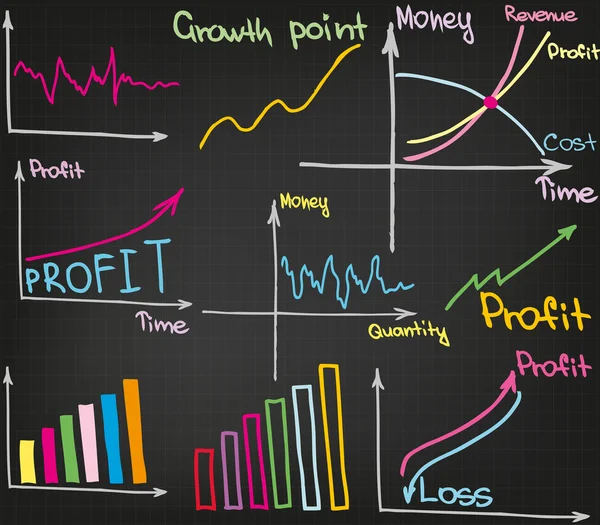
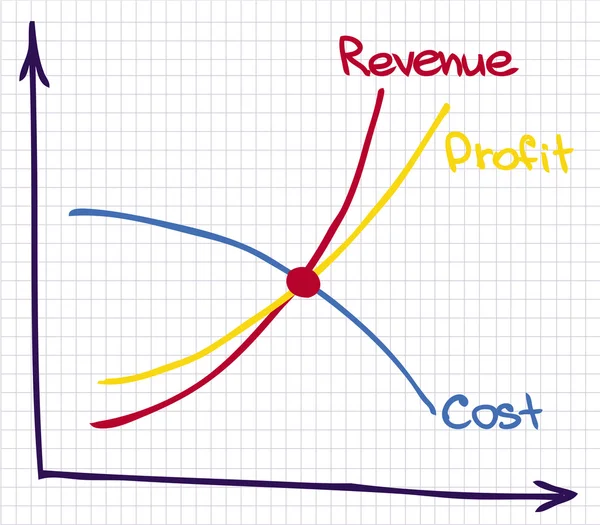
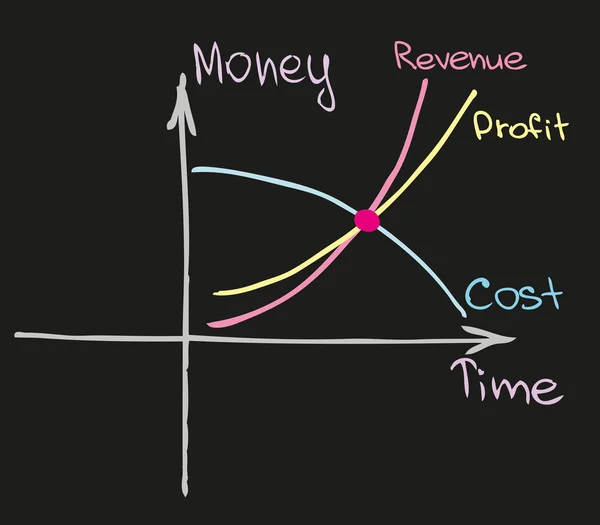
Financial chart — Stock Vector

Financial chart — Vector

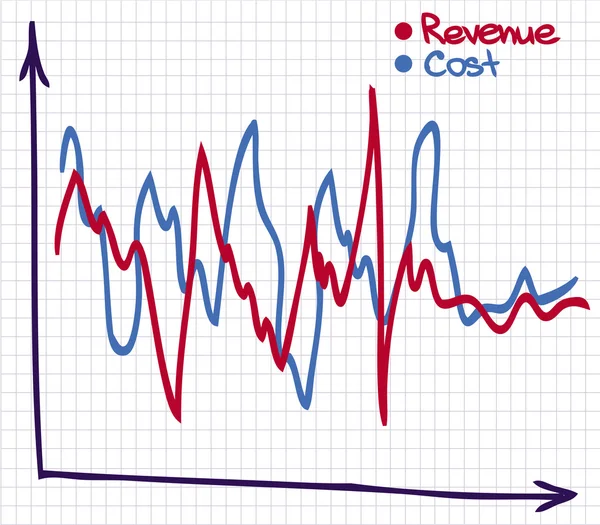
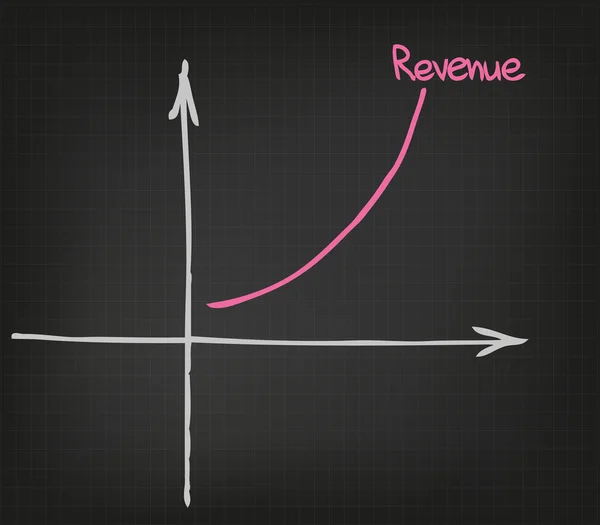
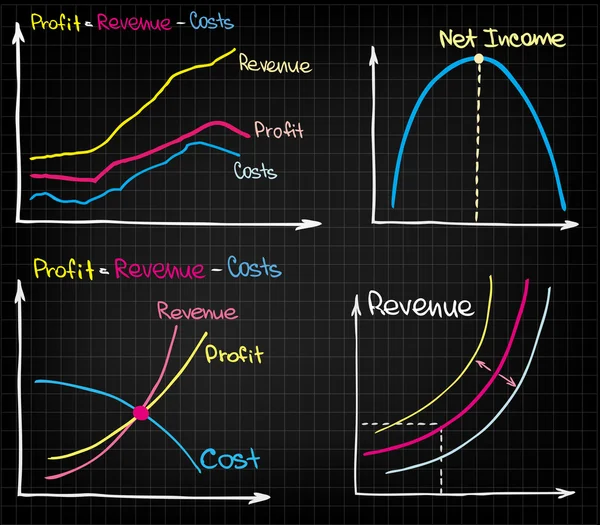
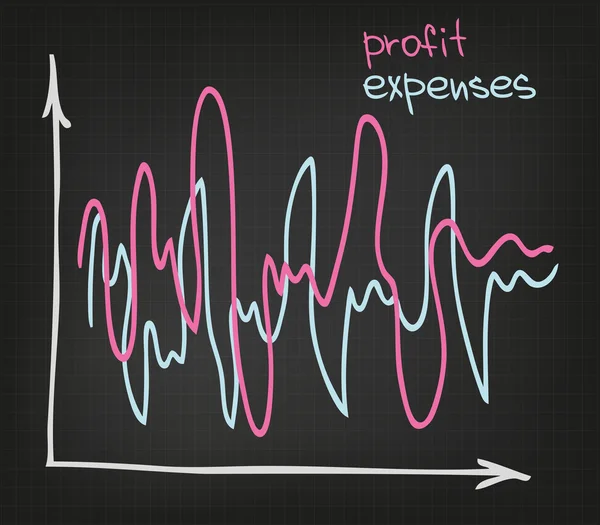
Revenue, cost charts. Easy to move and change colors and size.

 — Vector by kirovkat

Similar Stock Videos:

Animation of green lines and data processing over grid. global business, data processing and connections concept digitally generated video.
Animation Green Lines Data Processing Grid Global Business Data Processing — Stock Video
Raising financial business charts
Raising financial charts — Stock Video
Animation of a grey grid with numbers and red and green markers on white digital display. Global finances and statistics concept digitally generated image.
Animation Grey Grid Numbers Red Green Markers White Digital Display — Stock Video
Animation of green lines and data processing over grid. global business, data processing and connections concept digitally generated video.
Animation Green Lines Data Processing Grid Global Business Data Processing — Stock Video
4K financial stock chart,Business digital Data trend hud Graph,Stock Market,Changing Economic node line.
4K financial stock chart,Business Data trend hud Graph,Economic node line. — Stock Video
Animation of green lines and statistics processing over grid. global business, connections, data processing and technology concept digitally generated video.
Animation Green Lines Statistics Processing Grid Global Business Connections Data — Stock Video
Line graph profit growth on a white background
Line graph profit growth — Stock Video
Line graph profit growth on a white background
Line graph profit growth — Stock Video
COVID-19, Coronavirus. Growing graph of infected people. Concept for medical publishing, news, social media. Light grid background with red words. SARS-CoV-2
Covid Coronavirus Growing Graph Infected People Concept Medical Publishing News — Stock Video
Animation of green lines and data processing over grid. global business, data processing and connections concept digitally generated video.
Animation Green Lines Data Processing Grid Global Business Data Processing — Stock Video
Animation of red lines statistics processing over grid. global finances, business, digital interface and technology concept digitally generated video.
Animation Red Lines Statistics Processing Grid Global Finances Business Digital — Stock Video
Animation of three red statistic lines over a grey grid with numbers and markers appearing on digital display. Global finances and statistics concept digitally generated image.
Animation Three Red Statistic Lines Grey Grid Numbers Markers Appearing — Stock Video
Blue bar graph . High quality 4k footage
Blue bar graph — Stock Video
Bar chart showing growth on white paper or display 3d animation. High quality 4k footage
Bar chart showing growth on white paper or display 3d animation — Stock Video
Line graph profit growth on a white background
Line graph profit growth — Stock Video

Usage Information

You can use this royalty-free vector image "Financial chart" for personal and commercial purposes according to the Standard or Extended License. The Standard License covers most use cases, including advertising, UI designs, and product packaging, and allows up to 500,000 print copies. The Extended License permits all use cases under the Standard License with unlimited print rights and allows you to use the downloaded vector files for merchandise, product resale, or free distribution.

This stock vector image is scalable to any size. You can buy and download it in high resolution up to 5000x4377. Upload Date: Apr 7, 2014