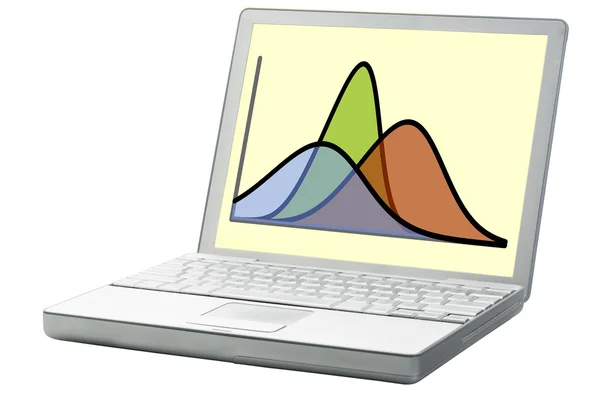
Graph of wave signals — Stock Photo, Image

Graph of wave signals — Photo

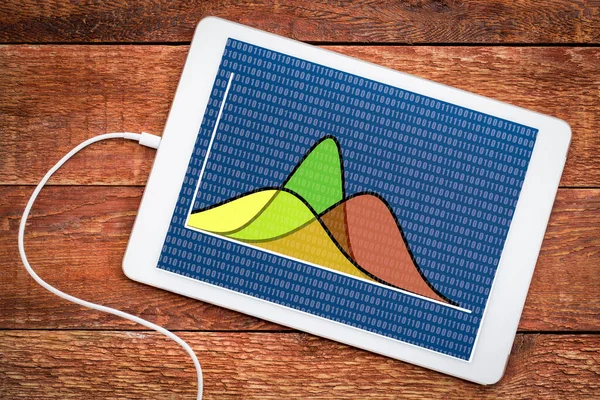
Graph of different wave signals on a digital tablet with a cup of coffee

 — Photo by PixelsAway

Same Series:

Statistics or analysis concept - three Gaussian (normal distribution) curves with binary background on a digital tablet
Statistics Analysis Concept Three Gaussian Normal Distribution Curves Binary Background — Stock Photo, Image
White chalk graph abstract on vintage slate blackboard
Chalk abstract on blackboard — Stock Photo, Image
Graph of data following Gaussian distribution and spreadsheet on a digital tablet with a cup of coffee, research and analysis concept
Graph Data Gaussian Distribution Spreadsheet Digital Tablet Cup Coffee Research — Stock Photo, Image
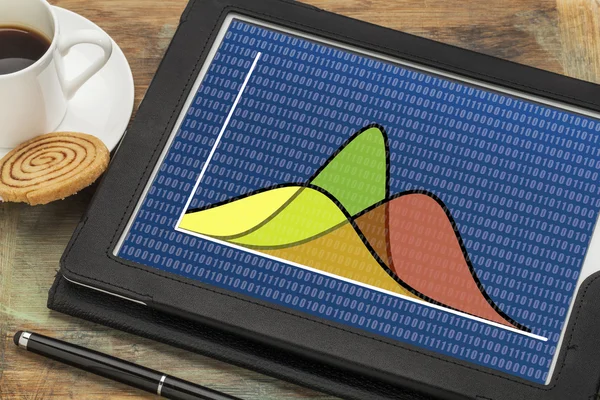
Statistics or analysis concept - three Gaussian (normal distribution) curves on a digital tablet with a cup of coffee
Gausian (bell) curves on tablet — Stock Photo, Image
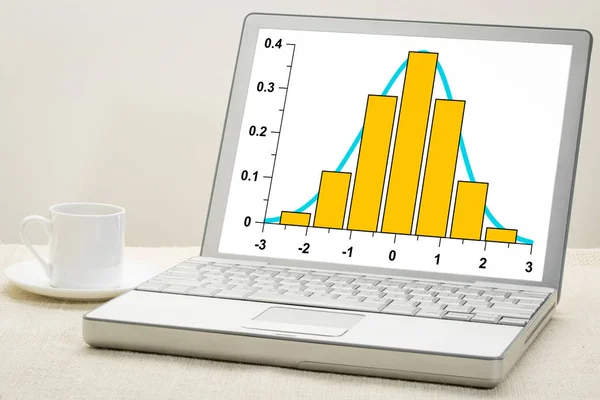
Graph of data following Gaussian distribution (bell curve) on a laptop with a cup of coffee, analysis and statistics concept
Graph Data Gaussian Distribution Bell Curve Laptop Cup Coffee Analysis — Stock Photo, Image
Sinusoid with a decreasing amplitude on vintage blackboard - a signal concept
Sinusoid on vintage blackboard — Stock Photo, Image
Gaussian, bell or normal distribution curve and histogram on laptop computer with a cup of coffee
Gaussian Bell Normal Distribution Curve Histogram Laptop Computer Cup Coffee — Stock Photo, Image
Statistics or analysis concept - three Gaussian (normal distribution) curves with binary background on a digital tablet
Gausian (bell) curves on tablet — Stock Photo, Image
Statistics or analysis concept - three Gaussian (normal distribution) curves on a laptop computer
Gausian (bell) curves on laptop — Stock Photo, Image
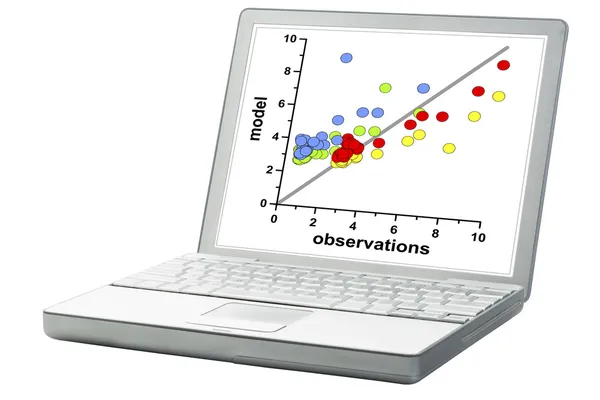
Correlation scatter graph of model and observation data on a digital tablet - science or business research concept
Model and observation data correlation graph — Stock Photo, Image
Scatter graph of model and observation data on a laptop - science research or business statistics concept
Scatter graph on a laptop — Stock Photo, Image
Outlier or outsider concept on a laptop, scatter graph of data
Outlier Outsider Concept Laptop Scatter Graph Data — Stock Photo, Image
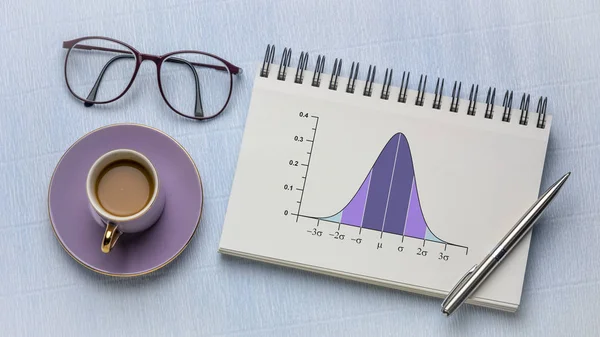
Gaussian, bell or normal distribution curve graph with standard deviations in a spiral notebook, with coffee and reading glasses, long banner format, business or science data analysis concept
Gaussian, bell or normal distribution curve — Stock Photo, Image
Stats (statistics) word abstract in vintage letterpress wood type printing blocks
Stats (statistics) word in wood type — Stock Photo, Image
Analysis word typography in vintage letterpress wood type printing blocks stained by color inks
Analysis word in wood type — Stock Photo, Image
Analysis word in vintage letterpress wood type blocks against textured paper
Analysis Word Vintage Letterpress Wood Type Blocks Textured Paper — Stock Photo, Image

Usage Information

You can use this royalty-free photo "Graph of wave signals" for personal and commercial purposes according to the Standard or Extended License. The Standard License covers most use cases, including advertising, UI designs, and product packaging, and allows up to 500,000 print copies. The Extended License permits all use cases under the Standard License with unlimited print rights and allows you to use the downloaded stock images for merchandise, product resale, or free distribution.

You can buy this stock photo and download it in high resolution up to 5100x3400. Upload Date: May 2, 2014