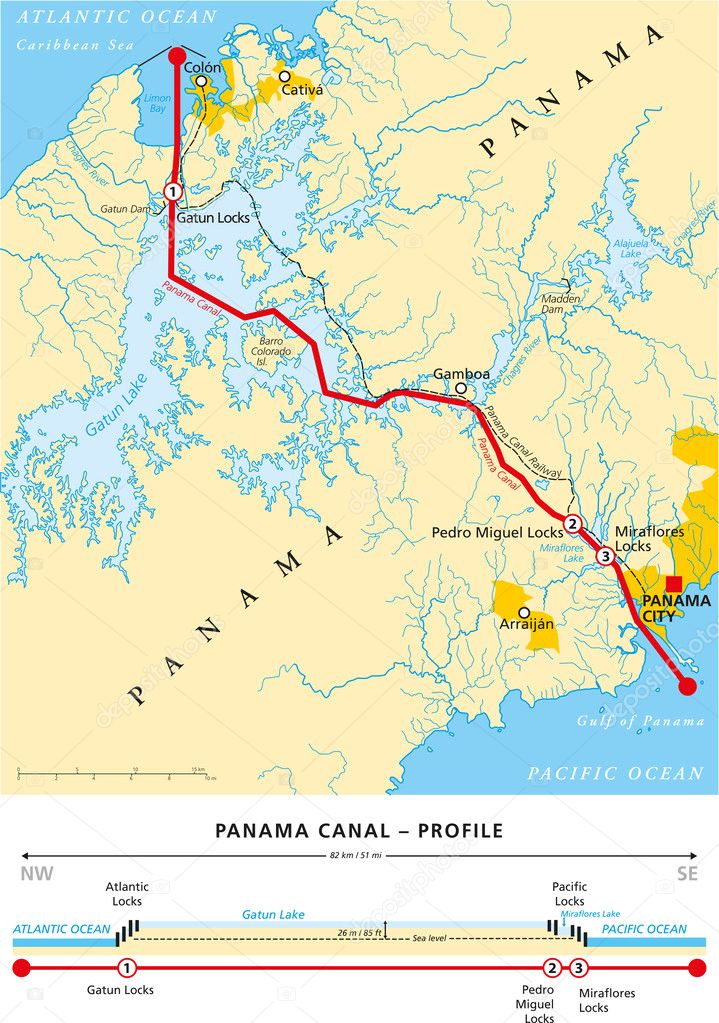
Panama Canal Political Map — Stock Vector

Panama Canal Political Map — Vector

Political map of Panama Canal - with cross-section, cities, rivers and lakes. Vector illustration with english labeling, description and scale.

 — Vector by Furian

Same Series:

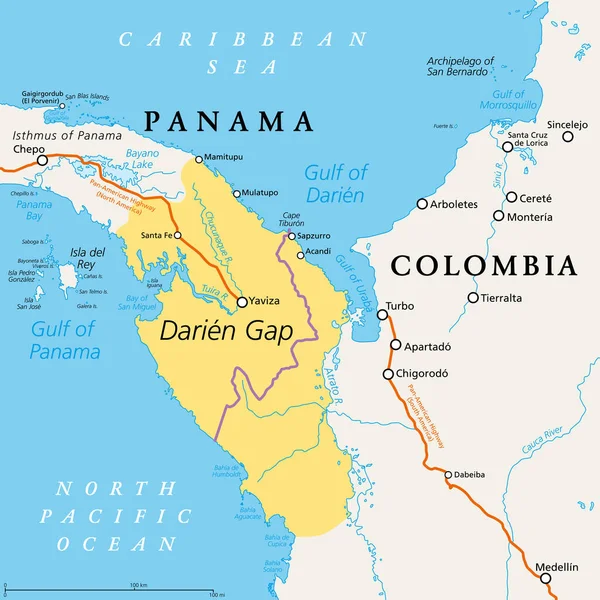
Darien Gap, political map. Geographical region in the Isthmus of Panama, connecting North and South America with Central America. The gap is in the Pan-American Highway of which a part were not built.
Darien Gap Political Map Geographical Region Isthmus Panama Connecting North — Stock Vector
Arctic Ocean sea routes, gray political map. Arctic shipping routes. Northwest Passage and Northern Sea Route. Maritime paths, used by vessels to navigate through the Arctic. Illustration. Vector.
Arctic Ocean Sea Routes Gray Political Map Arctic Shipping Routes — Stock Vector
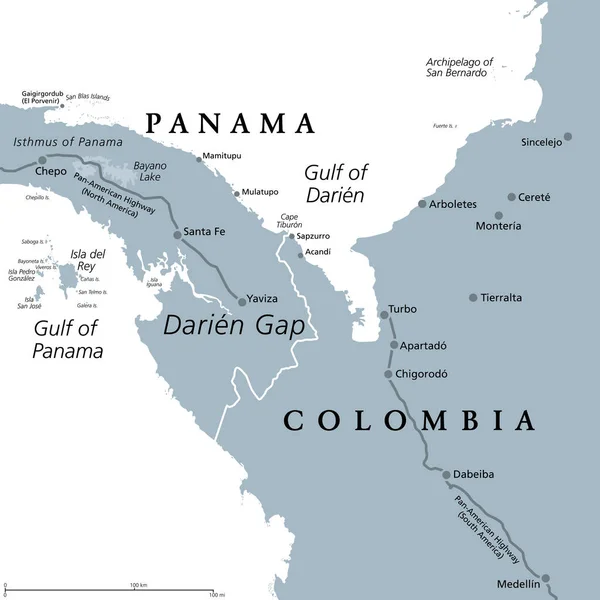
Darien Gap, gray political map. Region in the Isthmus of Panama, connecting North and South America with Central America. The gap is in the Pan-American Highway of which a part were not built.
Darien Gap Gray Political Map Region Isthmus Panama Connecting North — Stock Vector
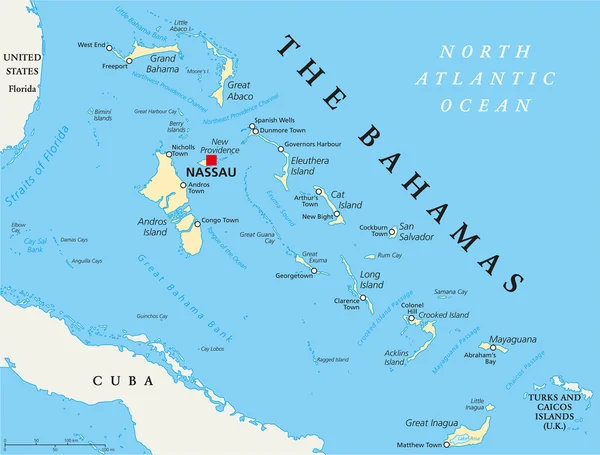
The Bahamas Political Map with capital Nassau, important cities and places. English labeling and scaling. Illustration.
The Bahamas Political Map — Stock Vector
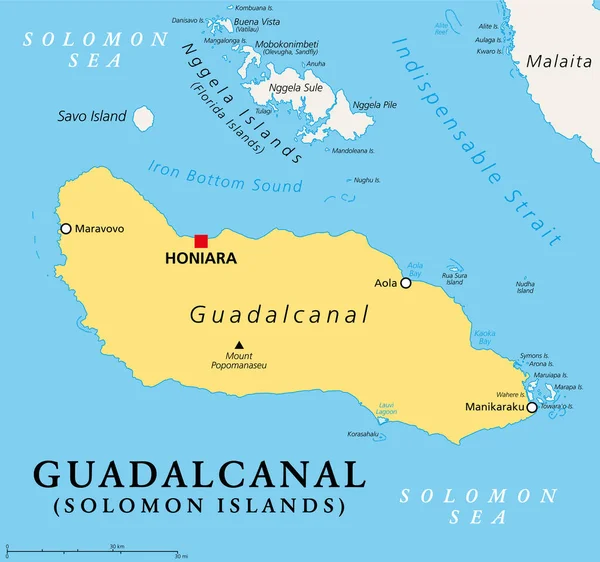
Guadalcanal, principal and largest island of the Solomon Islands, located in the Solomon Sea, and in the southwestern Pacific Ocean, with Honiara, the capital of the island country. Illustration.
Guadalcanal Principal Largest Island Solomon Islands Located Solomon Sea Southwestern — Stock Vector
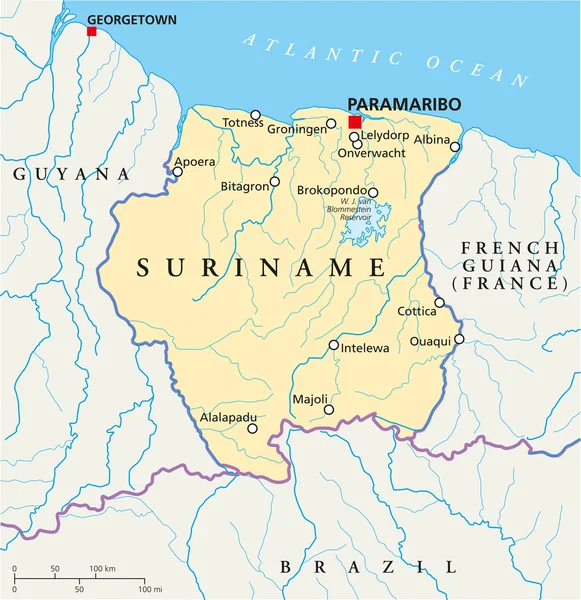
Suriname Political Map with capital Paramaribo, national borders, most important cities, rivers and lakes. Illustration with labeling and scaling.
Suriname Political Map — Stock Vector
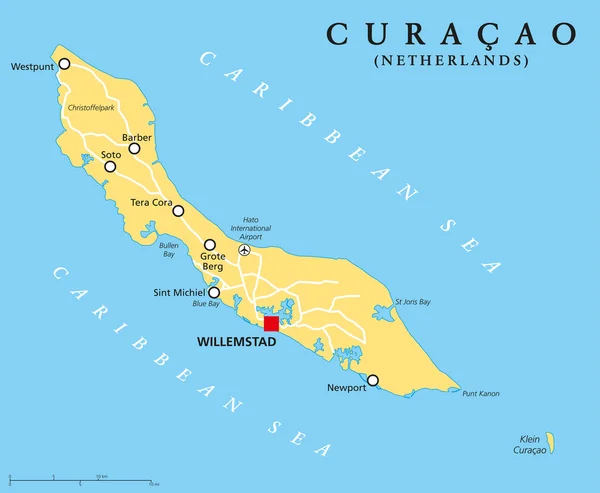
Curacao Political Map with capital Willemstad and important cities. English labeling and scaling. Illustration.
Curacao Political Map — Stock Vector
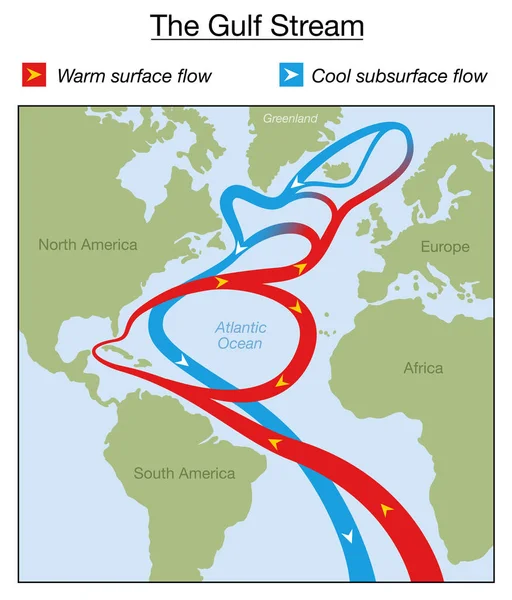
Gulf Stream chart. Warm surface and cold subsurface flow in the Atlantic Ocean between North and South America, Africa, Europe and Greenland. Red thermal surface and blue cooled deep-water currents.
Gulf Stream Chart Warm Surface Cold Subsurface Flow Atlantic Ocean — Stock Vector
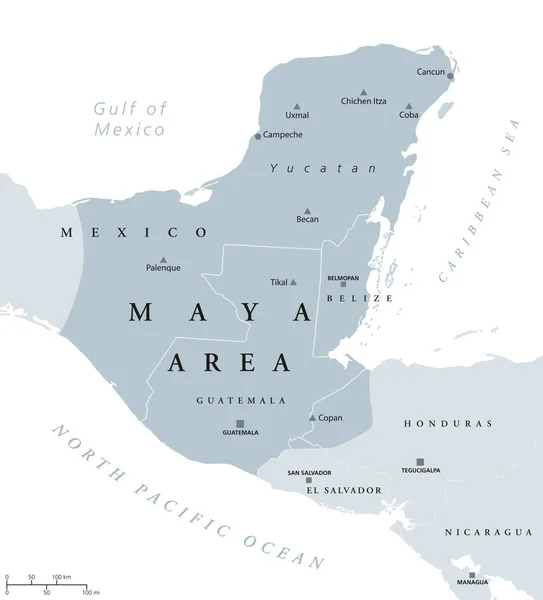
Maya area political map. Mesoamerican civilization and high culture of pre-Columbian Americas. Capitals, national borders and most important ancient cities. Illustration with English labeling. Vector.
Maya area political map — Stock Vector
Galapagos Islands, Ecuador, political map, with capital Puerto Baquerizo Moreno. Archipelago of volcanic islands on either side of equator in Pacific Ocean known for a large number of endemic species.
Galapagos Islands Ecuador Political Map Capital Puerto Baquerizo Moreno Archipelago — Stock Vector
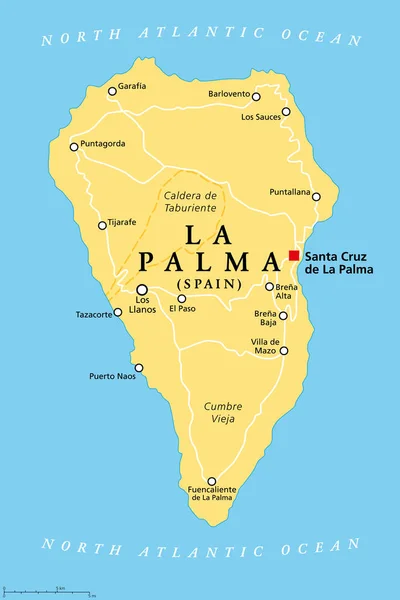
La Palma island, political map, with capital Santa Cruz. San Miguel de La Palma, north-western island of Canary Islands, autonomous community of Spain. With the Caldera de Taburiente and Cumbre Vieja.
Palma Island Political Map Capital Santa Cruz San Miguel Palma — Stock Vector
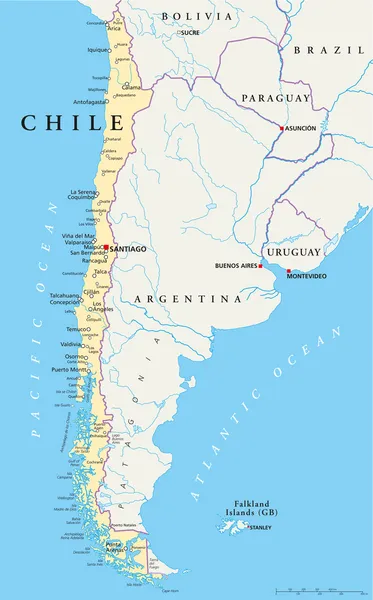
Political map of Chile with the capital Santiago, national borders, most important cities, rivers and lakes. Vector illustration with english labeling and scale.
Chile Political Map — Stock Vector
Curacao, gray political map. Island in the Leeward Antilles in the Caribbean Sea with capital Willemstad. Lesser Antilles island country and part of the ABC islands, off the coast of Venezuela. Vector
Curacao Gray Political Map Island Leeward Antilles Caribbean Sea Capital — Stock Vector
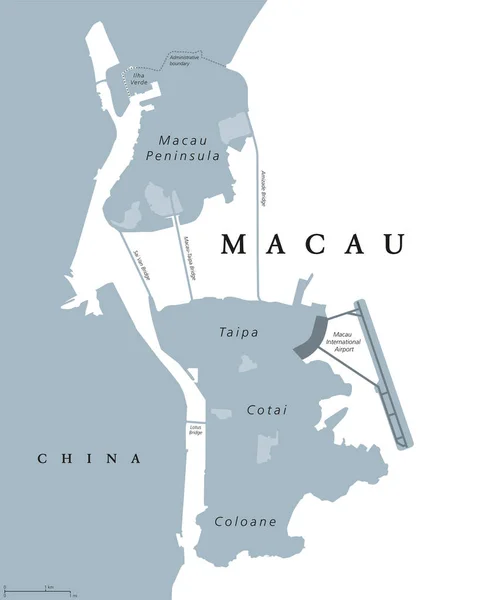
Macau political map. Also spelled Macao. English labeling. Special Administrative Region of Peoples Republic of China in East Asia. Worlds largest gambling centre. Gray illustration over white. Vector
Macau political map — Stock Vector
Anguilla Political Map with capital The Valley. British Overseas Territory in the Caribbean, most northerly of the Leeward Islands in the Lesser Antilles. English labeling and scaling. Illustration.
Anguilla Political Map — Stock Vector

Similar Stock Videos:
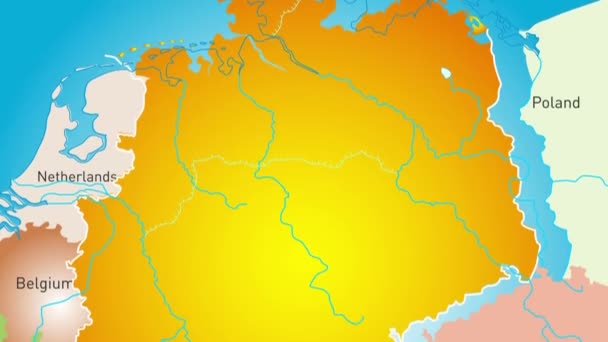
Animated detailed map of Germany country
Animated detailed map of Germany — Stock Video
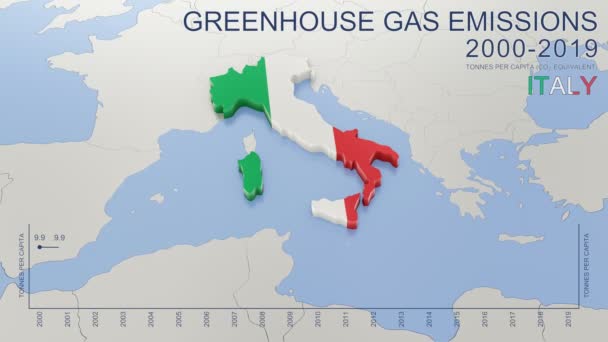
Greenhouse gas emissions in Italy from 2000 to 2019. Values in tonnes per capita (CO2 equivalent). Source data: Eurostat. 3D rendering loop able video with 4K resolution.
Greenhouse Gas Emissions Italy 2000 2019 Values Tonnes Capita Co2 — Stock Video
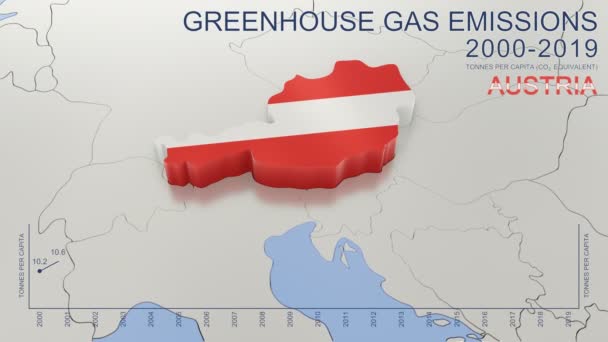
Greenhouse gas emissions in Austria from 2000 to 2019. Values in tonnes per capita (CO2 equivalent). Source data: Eurostat. 3D rendering loop able video with 4K resolution.
Greenhouse Gas Emissions Austria 2000 2019 Values Tonnes Capita Co2 — Stock Video
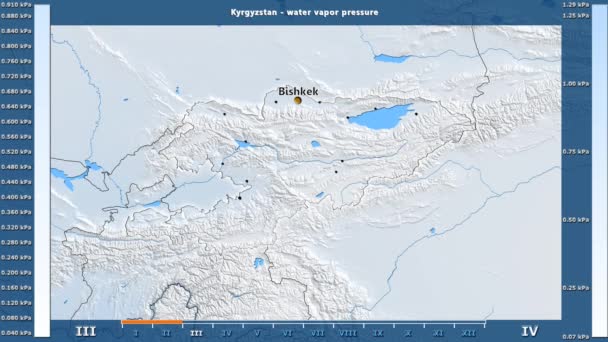
Water vapor pressure by month in the Kyrgyzstan area with animated legend - English labels: country and capital names, map description. Stereographic projection
Water Vapor Pressure Month Kyrgyzstan Area Animated Legend English Labels — Stock Video
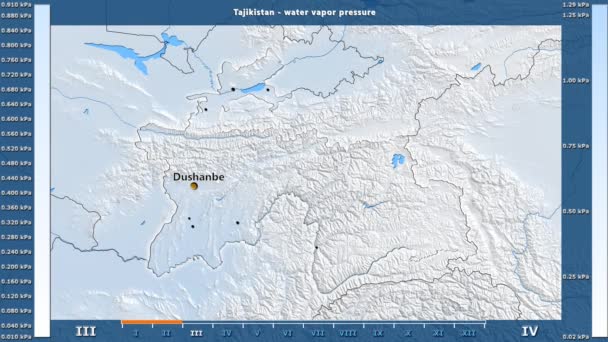
Water vapor pressure by month in the Tajikistan area with animated legend - English labels: country and capital names, map description. Stereographic projection
Water Vapor Pressure Month Tajikistan Area Animated Legend English Labels — Stock Video
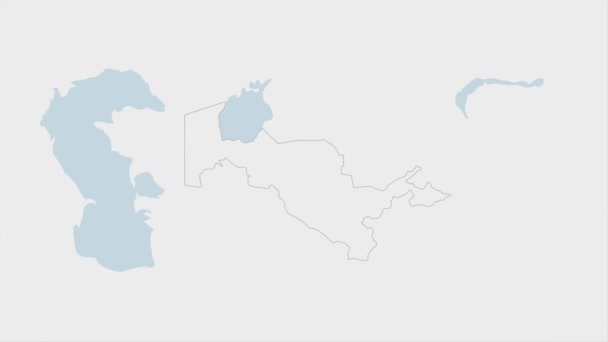
Uzbekistan map highlighted in Uzbekistan flag colors and pin of country capital Tashkent, map with neighboring Asian countries.
Uzbekistan Map Highlighted Uzbekistan Flag Colors Pin Country Capital Tashkent — Stock Video
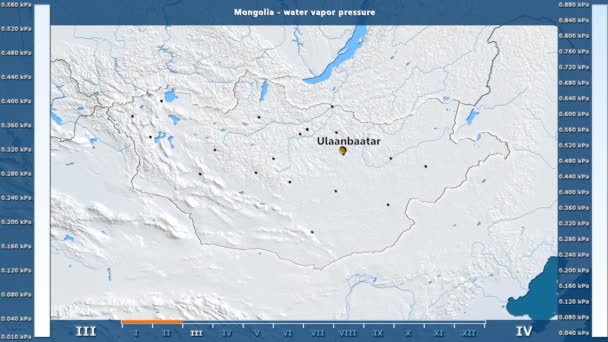
Water vapor pressure by month in the Mongolia area with animated legend - English labels: country and capital names, map description. Stereographic projection
Water Vapor Pressure Month Mongolia Area Animated Legend English Labels — Stock Video
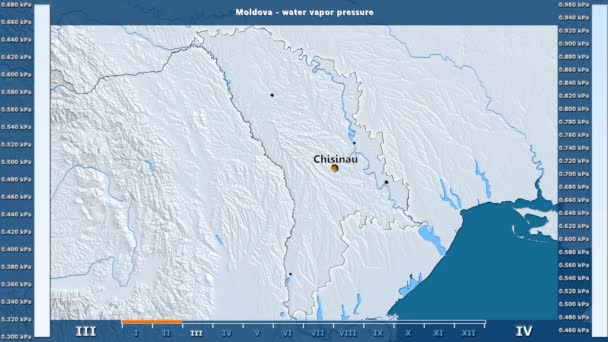
Water vapor pressure by month in the Moldova area with animated legend - English labels: country and capital names, map description. Stereographic projection
Water Vapor Pressure Month Moldova Area Animated Legend English Labels — Stock Video
India map highlighted in India flag colors and pin of country capital New Delhi, map with neighboring Asian countries.
India Map Highlighted India Flag Colors Pin Country Capital New — Stock Video
Water vapor pressure by month in the Belgium area with animated legend - English labels: country and capital names, map description. Stereographic projection
Water Vapor Pressure Month Belgium Area Animated Legend English Labels — Stock Video
James Cook. great geographical discoveries. trip around the world
The great world tour - James Cook. — Stock Video
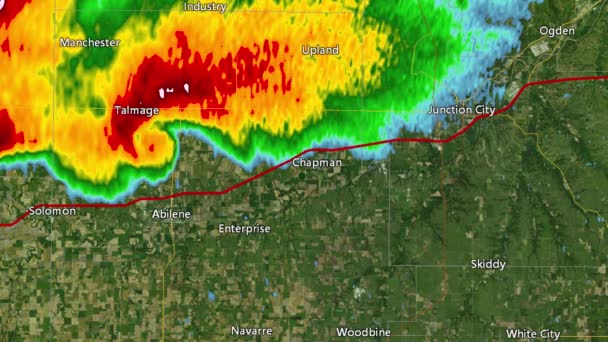
2016 Solomon/Abeline/Chapman, Kansas tornado event. Depicts radar imagery (reflectivity) taken by National Weather Service NEXRAD radar. There is an identical version WITH warning boxes available in our portfolio
2016 Solomon/Abilene/Chapman, KS Tornado Doppler Radar (Without Warn Boxes) — Stock Video
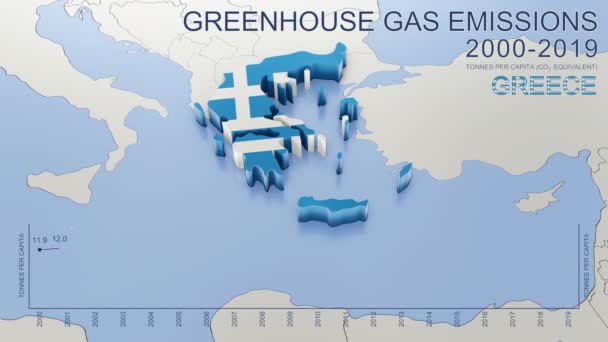
Greenhouse gas emissions in Greece from 2000 to 2019. Values in tonnes per capita (CO2 equivalent). Source data: Eurostat. 3D rendering loop able video with 4K resolution.
Greenhouse Gas Emissions Greece 2000 2019 Values Tonnes Capita Co2 — Stock Video
Greenhouse gas emissions in France from 2000 to 2019. Values in tonnes per capita (CO2 equivalent). Source data: Eurostat. 3D rendering loop able video with 4K resolution.
Greenhouse Gas Emissions France 2000 2019 Values Tonnes Capita Co2 — Stock Video
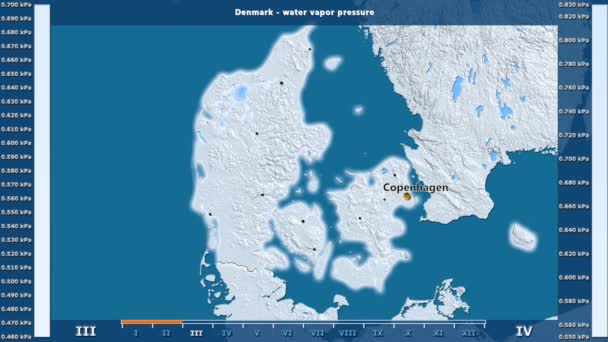
Water vapor pressure by month in the Denmark area with animated legend - English labels: country and capital names, map description. Stereographic projection
Water Vapor Pressure Month Denmark Area Animated Legend English Labels — Stock Video
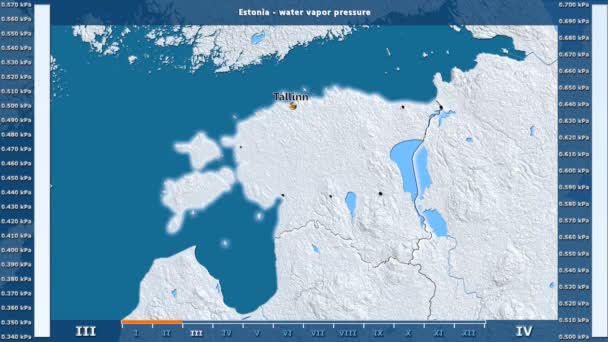
Water vapor pressure by month in the Estonia area with animated legend - English labels: country and capital names, map description. Stereographic projection
Water Vapor Pressure Month Estonia Area Animated Legend English Labels — Stock Video
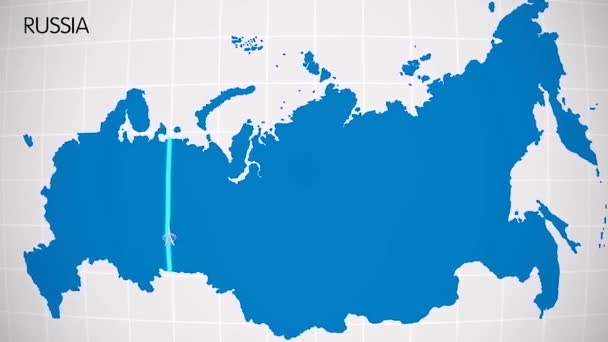
The division of Europe and Asia on the map. the city Ekaterinburg divides Europe and Asia. Eurasia on the map Animation. Eurasia. Yekaterinburg animation HD
The division of Europe and Asia on the map. the city Ekaterinburg divides Europe and Asia. Eurasia on the map Animation. Eurasia. Yekaterinburg animation — Stock Video
Water vapor pressure by month in the Estonia area with animated legend - glowing shape, administrative borders, main cities, capital. Stereographic projection
Water Vapor Pressure Month Estonia Area Animated Legend Glowing Shape — Stock Video

Usage Information

You can use this royalty-free vector image "Panama Canal Political Map" for personal and commercial purposes according to the Standard or Extended License. The Standard License covers most use cases, including advertising, UI designs, and product packaging, and allows up to 500,000 print copies. The Extended License permits all use cases under the Standard License with unlimited print rights and allows you to use the downloaded vector files for merchandise, product resale, or free distribution.

This stock vector image is scalable to any size. You can buy and download it in high resolution up to 6000x8541. Upload Date: May 3, 2014