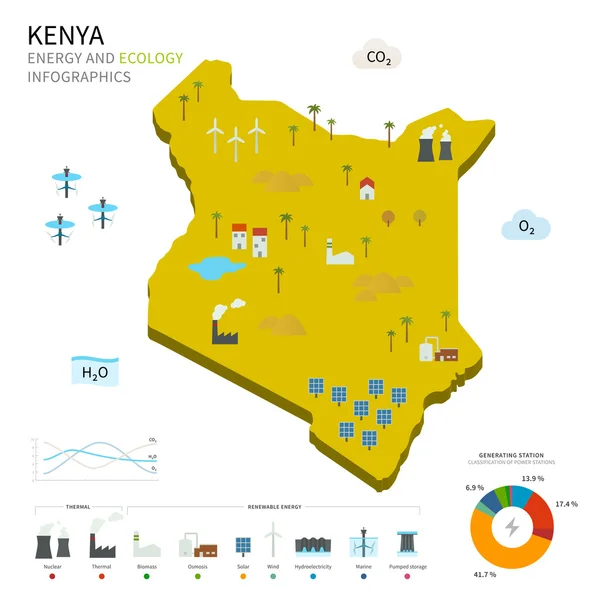
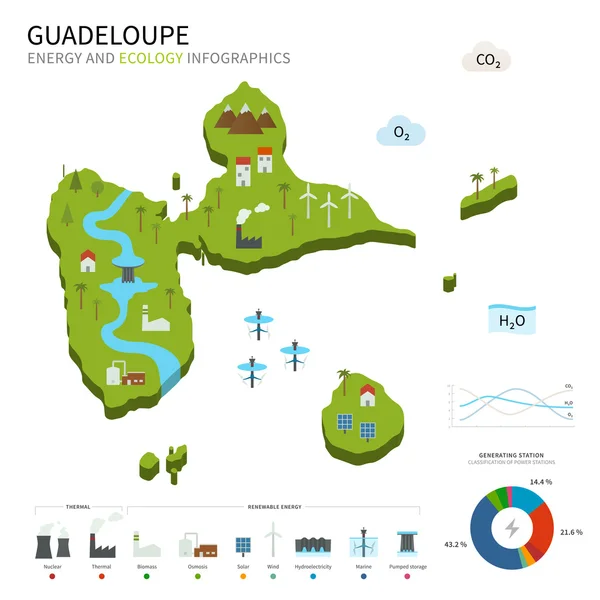
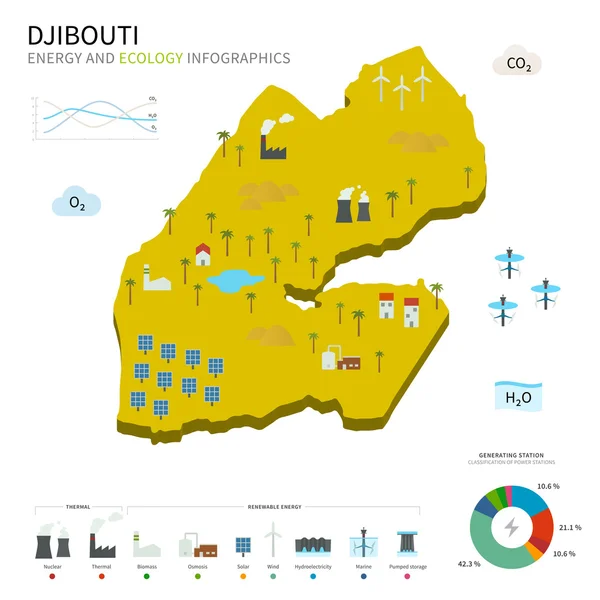
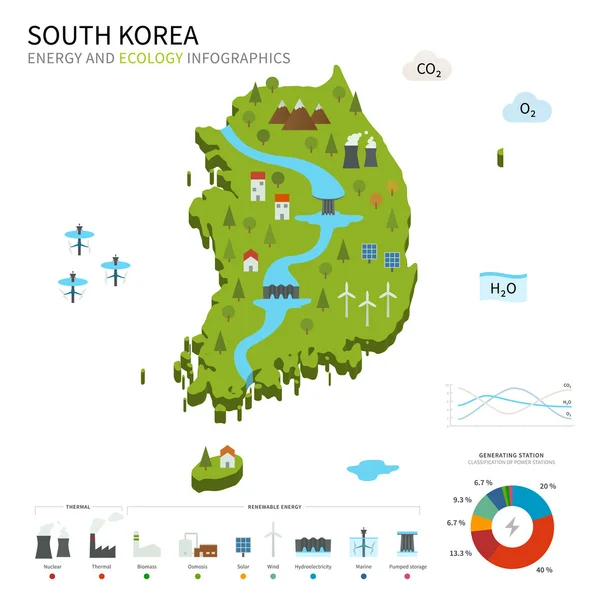
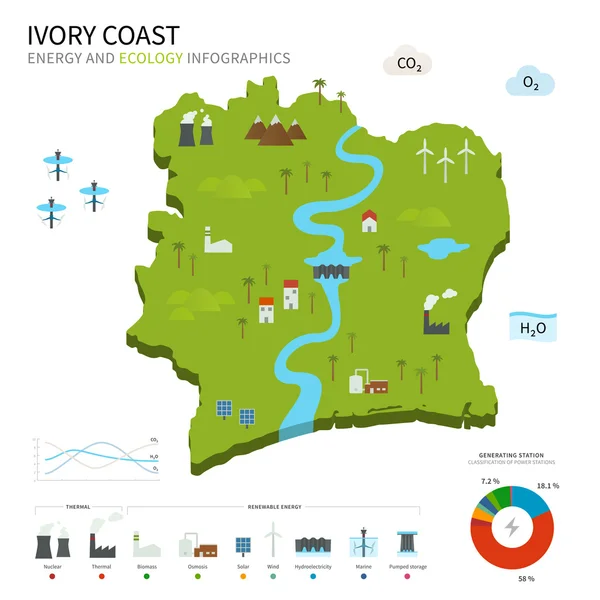
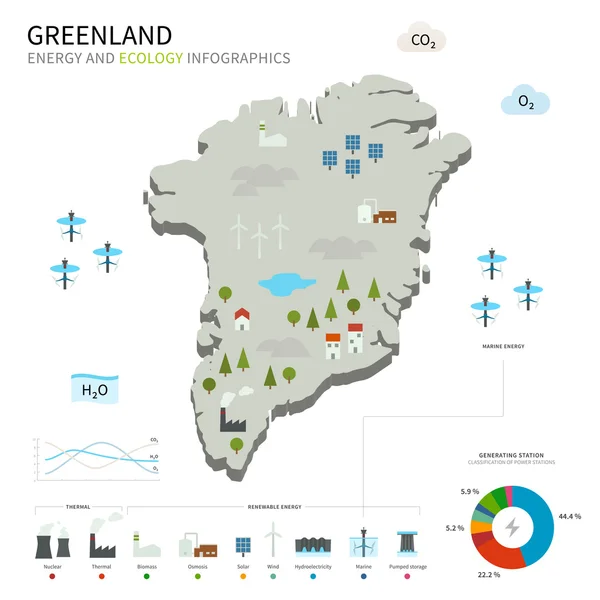
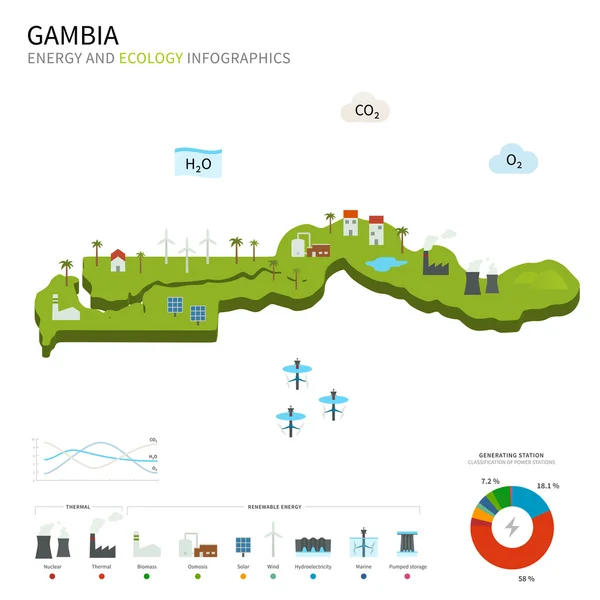
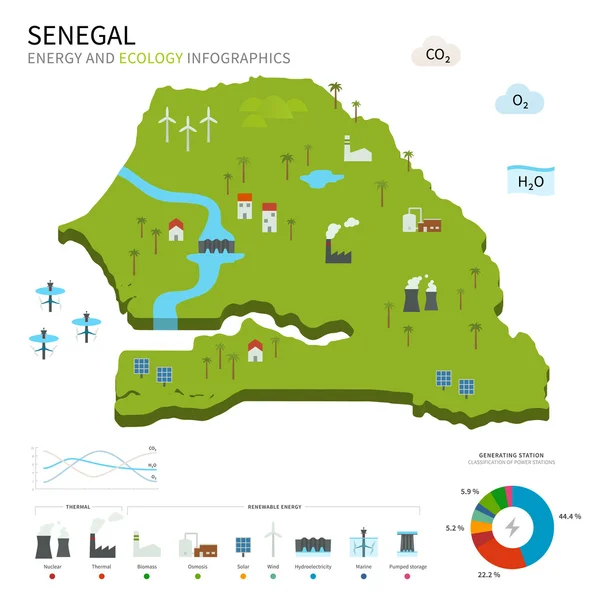
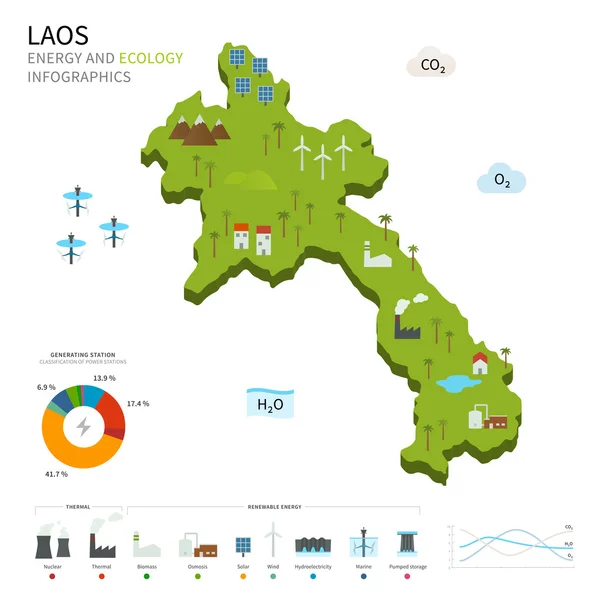
Energy industry and ecology of KwaZulu — Stock Vector

Energy industry and ecology of KwaZulu — Vector

Energy industry and ecology of KwaZulu vector map with power stations infographic.

 — Vector by tkacchuk

Similar Stock Videos:
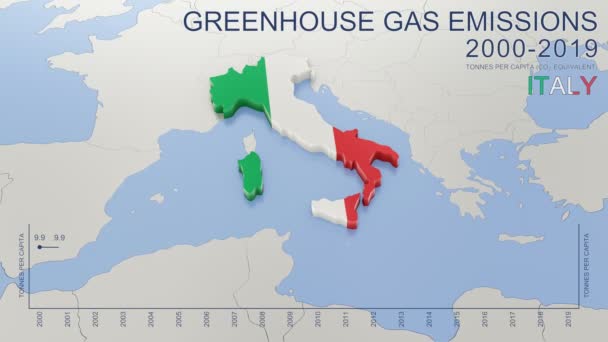
Greenhouse gas emissions in Italy from 2000 to 2019. Values in tonnes per capita (CO2 equivalent). Source data: Eurostat. 3D rendering loop able video with 4K resolution.
Greenhouse Gas Emissions Italy 2000 2019 Values Tonnes Capita Co2 — Stock Video
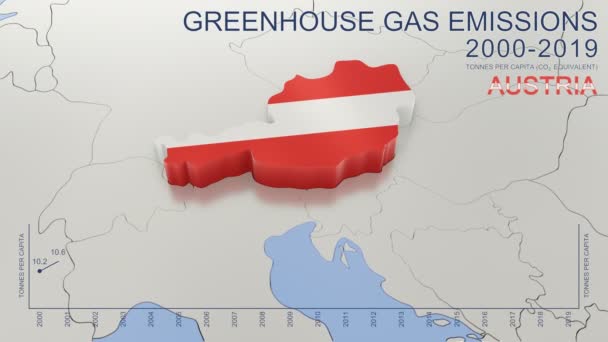
Greenhouse gas emissions in Austria from 2000 to 2019. Values in tonnes per capita (CO2 equivalent). Source data: Eurostat. 3D rendering loop able video with 4K resolution.
Greenhouse Gas Emissions Austria 2000 2019 Values Tonnes Capita Co2 — Stock Video
India map highlighted in India flag colors and pin of country capital New Delhi, map with neighboring Asian countries.
India Map Highlighted India Flag Colors Pin Country Capital New — Stock Video
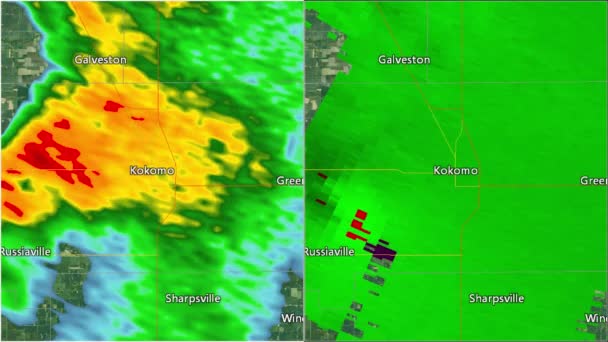
2016 Kokomo, IN tornado. Depicts radar imagery (reflectivity) on the left, and base velocity (wind speed and direction) on the right. Taken by National Weather Service NEXRAD radar.
2016 Kokomo, IN Tornado Doppler Radar Split-screen — Stock Video
Uzbekistan map highlighted in Uzbekistan flag colors and pin of country capital Tashkent, map with neighboring Asian countries.
Uzbekistan Map Highlighted Uzbekistan Flag Colors Pin Country Capital Tashkent — Stock Video
The division of Europe and Asia on the map. the city Ekaterinburg divides Europe and Asia. Eurasia on the map Animation. Eurasia. Yekaterinburg animation HD
The division of Europe and Asia on the map. the city Ekaterinburg divides Europe and Asia. Eurasia on the map Animation. Eurasia. Yekaterinburg animation — Stock Video
Global warming prevention image with renewable energy in urban and rural areas
Global Warming Prevention Image Renewable Energy Urban Rural Areas — Stock Video
Animated detailed map of Germany country
Animated detailed map of Germany — Stock Video
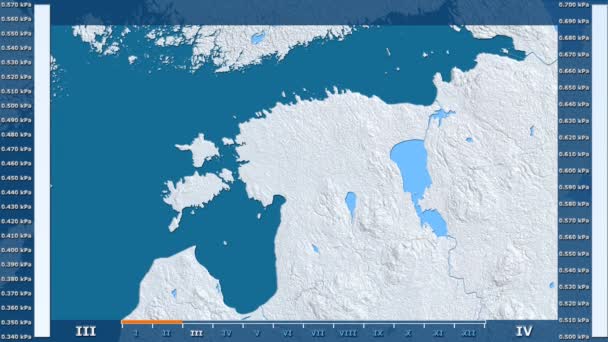
Water vapor pressure by month in the Estonia area with animated legend - raw color shader. Stereographic projection
Water Vapor Pressure Month Estonia Area Animated Legend Raw Color — Stock Video
Real colors of forest, mountains and sea. Map of New York. Zoom from a world map to a map of New York. 4K FHD 60 fps animation.
Real colors of forest, mountains and sea. Map of New York. World map. Map of the USA. Zoom from a world map to a map of New York. Zoom from USA map to New York map. 4K FHD 60 fps animation. — Stock Video
Aerial view of glacial meltwaters and volcanic ash in river deltas carving through flood plains, Arctic region, Northern Hemisphere
Aerial View of Glacial mMltwaters & Flooded Plains, Iceland — Stock Video
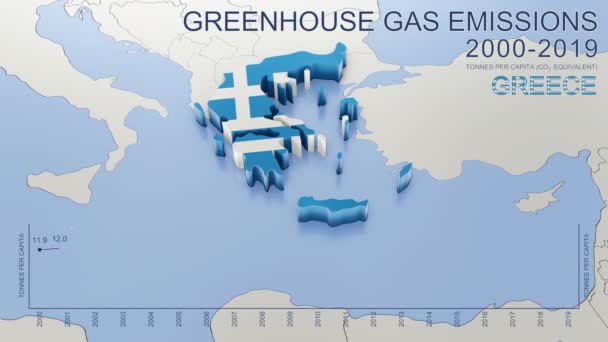
Greenhouse gas emissions in Greece from 2000 to 2019. Values in tonnes per capita (CO2 equivalent). Source data: Eurostat. 3D rendering loop able video with 4K resolution.
Greenhouse Gas Emissions Greece 2000 2019 Values Tonnes Capita Co2 — Stock Video
Greenhouse gas emissions in Denmark from 2000 to 2019. Values in tonnes per capita (CO2 equivalent). Source data: Eurostat. 3D rendering loop able video with 4K resolution.
Greenhouse Gas Emissions Denmark 2000 2019 Values Tonnes Capita Co2 — Stock Video
Average temperature by month in the Nepal area with animated legend - raw color shader. Stereographic projection
Average Temperature Month Nepal Area Animated Legend Raw Color Shader — Stock Video
Precipitation by month in the Estonia area with animated legend - raw color shader. Stereographic projection
Precipitation Month Estonia Area Animated Legend Raw Color Shader Stereographic — Stock Video
The plane takes off and land at the airport in the night and day. There are views from the windows and interior. Check out the runway, accelerate and take off into the night. View the wing against the sky.
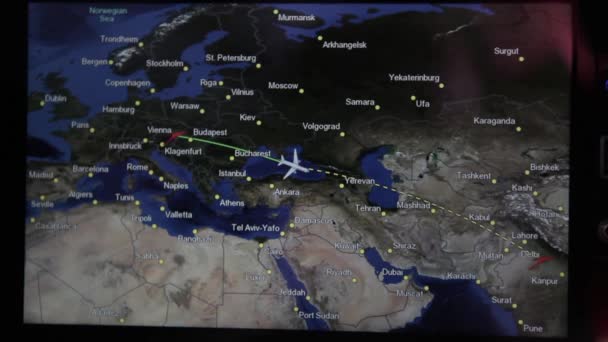
The plane takes off at the airport. Exterior and interior. People and flight attendant on the plane are going. The TV screen shows parameters of the flight. — Stock Video
Greenhouse gas emissions in France from 2000 to 2019. Values in tonnes per capita (CO2 equivalent). Source data: Eurostat. 3D rendering loop able video with 4K resolution.
Greenhouse Gas Emissions France 2000 2019 Values Tonnes Capita Co2 — Stock Video
2011 Joplin, Missouri tornado. Depicts radar imagery (reflectivity) on the left, and base velocity (wind speed and direction) on the right. Taken by National Weather Service NEXRAD radar.
2011 Joplin MO Tornado Split Screen — Stock Video

Usage Information

You can use this royalty-free vector image "Energy industry and ecology of KwaZulu" for personal and commercial purposes according to the Standard or Extended License. The Standard License covers most use cases, including advertising, UI designs, and product packaging, and allows up to 500,000 print copies. The Extended License permits all use cases under the Standard License with unlimited print rights and allows you to use the downloaded vector files for merchandise, product resale, or free distribution.

This stock vector image is scalable to any size. You can buy and download it in high resolution up to 6400x6400. Upload Date: Oct 15, 2014