Businessman analysing a set of graphs — Stock Photo, Image

Businessman analysing a set of graphs — Photo

Businessman analysing a set of bar, pie and triangular graphs as he sits at his desk pointing to one document he is holding, close up greyscale in a business analysis, projections and strategy concept

 — Photo by Gajus-Images

Same Series:

Close-up of businessman's hands holding a diagram 2012.
Businessman — Stock Photo, Image
Hands of a businessman analysing two pie graphs as he sits at his desk pointing to one pie graph, in a business strategy concept.
Hands of a businessman analysing two pie graphs — Stock Photo, Image
Side view of a businessman's hand drawing business graph with a chalk on a black board.
Side view of a businessman's hand drawing business graph — Stock Photo, Image
Black ballpoint pen on a white office desk next to a grayscale printed 3d column chart, used to present data and trends in statistics.
Black ballpoint next to a printed 3d column chart — Stock Photo, Image
Closeup of businessman reviewing report paper with graphs and pie charts in a conceptual image.
Businessman reviewing report paper with graphs — Stock Photo, Image
Close up of a businessman analysing a set of bar and pie graphs as he sits at his white desk.
Businessman analysing a set of bar and pie graphs — Stock Photo, Image
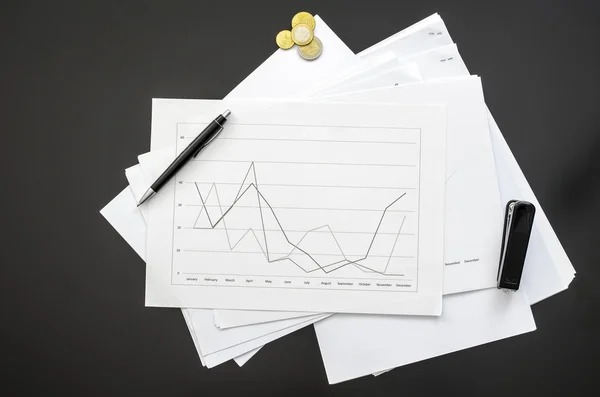
Top view of a graph document on a black office desk.
Documents on a black office desk — Stock Photo, Image
Businessman pulling graph column upwards on a virtual screen.
Businessman pulling graph column upwards — Stock Photo, Image
Retro image of businessman analysing printed business documents as he sits at his white desk pointing to one line chart, in a business analysis and strategy concept.
Retro image of businessman analysing printed business documents — Stock Photo, Image
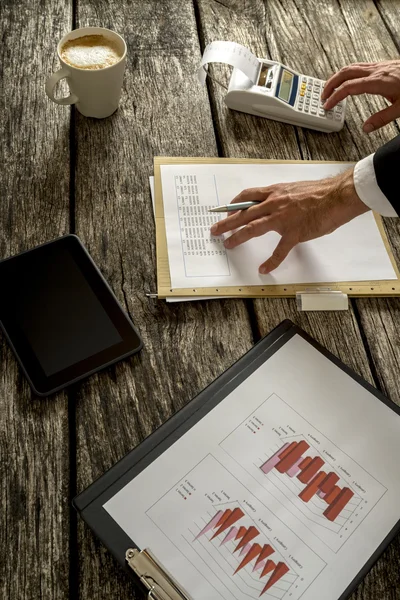
Hand of a Businessman Calculating Sales on Summary Report Using Printing Calculator on Top of a Rustic Wooden Table with Cup of Coffee, Tablet Computer and Document with Graphs.
Businessman Calculating Sales on the Table — Stock Photo, Image
Retro image of ballpoint pen next to a printed 3d column chart, used to present data and trends in statistics.
Data and trends in statistics — Stock Photo, Image
Business adviser or banker making calculations on a desktop calculator while reviewing annual financial report and charts.
Business adviser or banker making calculations on a desktop calc — Stock Photo, Image
Closeup of businessman pulling virtual graph column upwards. Concept of determination to succeed in business.
Businessman pulling virtual graph column upwards — Stock Photo, Image
Top view of male hand holding a pen over a business document.
Business document — Stock Photo, Image
Businessman reviewing statistical report in a clipboard binder. Over white background.
Businessman reviewing statistical report — Stock Photo, Image
Businessman presenting interactive business graph.
Interactive business graph — Stock Photo, Image

Usage Information

You can use this royalty-free photo "Businessman analysing a set of graphs" for personal and commercial purposes according to the Standard or Extended License. The Standard License covers most use cases, including advertising, UI designs, and product packaging, and allows up to 500,000 print copies. The Extended License permits all use cases under the Standard License with unlimited print rights and allows you to use the downloaded stock images for merchandise, product resale, or free distribution.

You can buy this stock photo and download it in high resolution up to 5760x3240. Upload Date: Nov 6, 2014