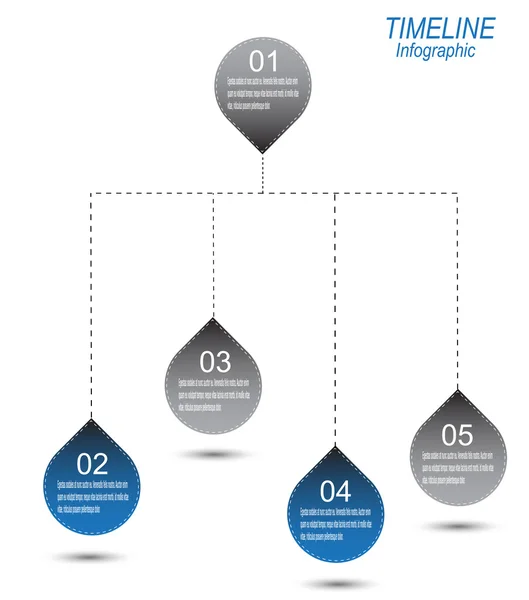
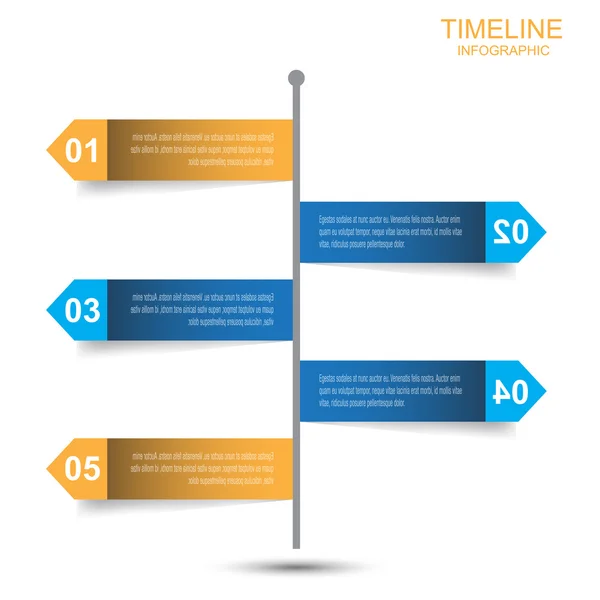
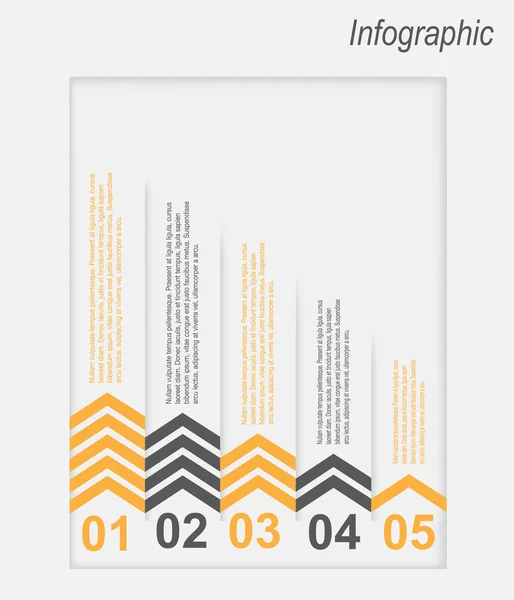
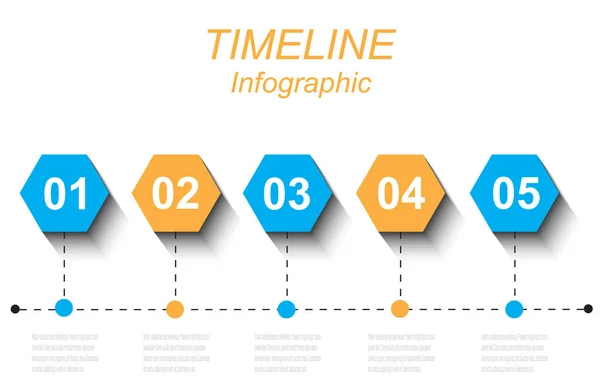
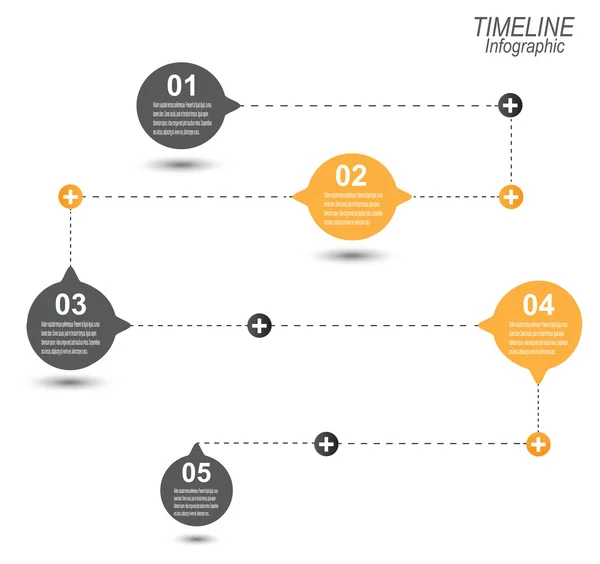
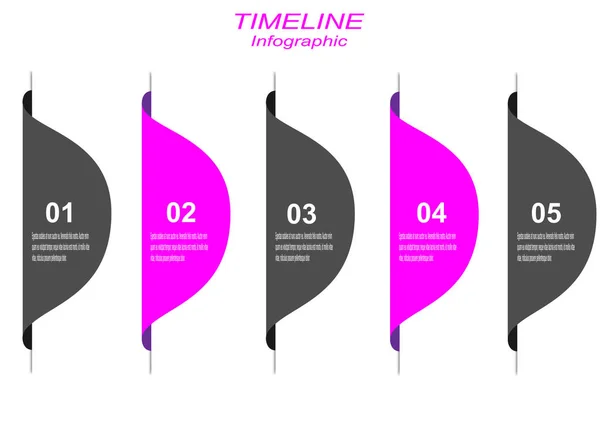
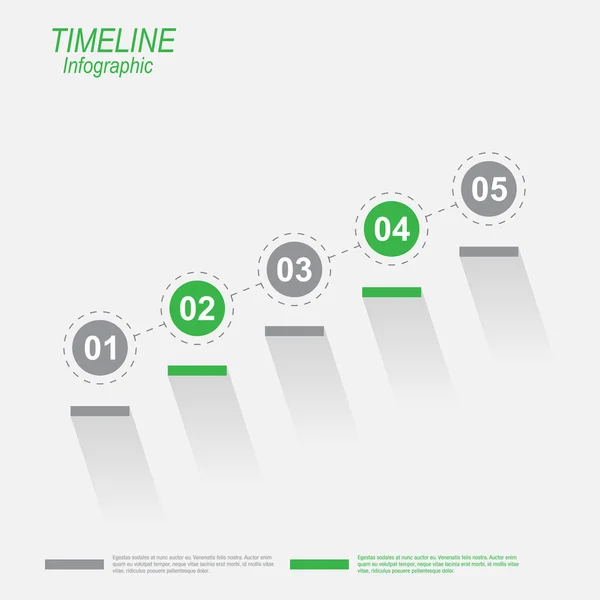
Timeline Infographic design template. — Stock Vector

Timeline Infographic design template. — Vector

Time line to display your data with Info-graphic elements. Idea to display information, ranking and statistics.

 — Vector by PlutonII

Similar Stock Videos:

Colorful corporate infographic elements bundle. Can be used for workflow, startup, business success, diagram, presentation, banner, teamwork, design, infographic elements set information infographics
Colorful Corporate Infographic Elements — Stock Video
Bar graph chart with axis illustrated small data business concept. Grow chart animation for yours presentation. 4K motion graphic video clip isolated on white background
Bar graph chart with arrows axis. — Stock Video
Bar graph chart with axis illustrated small data business concept. Grow chart animation for yours presentation. 4K motion graphic video clip isolated on white background
Bar graph chart with arrows axis. — Stock Video
Animation of Covid-19 Stock Market Crash written over chart and statistics showing financial data on purple background. Global finance and stock market crisis and recession coronavirus Covid pandemic concept digitally generated image.
Animation Covid Stock Market Crash Written Chart Statistics Showing Financial — Stock Video
Colorful corporate infographic elements bundle. Can be used for workflow, startup, business success, diagram, presentation, banner, teamwork, design, infographic elements set information infographics
Colorful Corporate Infographic Elements — Stock Video
Big Infographics set. Animation of different charts and graphs in orange and gray colors. 4K resolution animation.
Big Infographics set. Animation of different charts and graphs in orange and gray colors. 4K resolution animation — Stock Video
A set of circle color diagrams and charts on the white background.
Circle graphs and diagrams on the white background — Stock Video
Dashboard infographic animation in motion graphics 2d with statistics graphs. Pie charts, workflow, and UI elements.
Dashboard Infographic Animation Motion Graphics Statistics Graphs Pie Charts Workflow — Stock Video
Flowchart infographic, 5 square and empty space for icon and text on white background with map. Timeline diagram template, layout in blue color. Use for business presentation, financial world reports.
Timeline diagram template, layout in blue color. Flowchart infographic with 5 step on white background with map. — Stock Video
Colorful corporate infographic elements bundle. Can be used for workflow, startup, business success, diagram, presentation, banner, teamwork, design, infographic elements set information infographics
Colorful Corporate Infographic Elements — Stock Video
Animation of Covid-19 Stock Market Crash written over chart and statistics showing financial data on green background. Global finance and stock market crisis and recession coronavirus Covid pandemic concept digitally generated image.
Animation Covid Stock Market Crash Written Chart Statistics Showing Financial — Stock Video
Infographic elements. Round business diagram. Percent table. Marketing plan. HD video with alfa
Infographic elements. Round business diagram. Percent table. Marketing plan. HD video — Stock Video
Bar graph with axis, pie and venn diagrams. Grow chart business concept. Animation for yours big data presentation. 4K video clip.
Bar graph with axis. Animation. — Stock Video

Usage Information

You can use this royalty-free vector image "Timeline Infographic design template." for personal and commercial purposes according to the Standard or Extended License. The Standard License covers most use cases, including advertising, UI designs, and product packaging, and allows up to 500,000 print copies. The Extended License permits all use cases under the Standard License with unlimited print rights and allows you to use the downloaded vector files for merchandise, product resale, or free distribution.

This stock vector image is scalable to any size. You can buy and download it in high resolution up to 4800x3900. Upload Date: Dec 19, 2014