Economic forecast for 2015 — Stock Photo, Image

Economic forecast for 2015 — Photo

Different charts with the economic forecast for 2015 in a tablet, on a desk full of charts

 — Photo by nito103

Same Series:

Closeup of a concerned young caucasian businessman sitting at his office desk with his hands in his head, observing the economical balance of the year 2016 in his tablet computer
Man observing charts of 2016 in his tablet — Stock Photo, Image
Man wearing a suit sitting in a desk with a pile of charts and showing a 2014 calendar
Man in suit with charts and a 2014 calendar — Stock Photo, Image
A young Caucasian businessman celebrates the new year in his office with a glass with liquor in his hand and the number 2016 in the screen of a tablet, and some party horns, streamers and confetti
Businessman celebrating the new year in his office — Stock Photo, Image
Businessman in his office desk observing a chart with an upward trend, with a 2015 calendar in the background
Businessman observing a chart with an upward trend — Stock Photo, Image
A young businessman in his office desk showing a 2015 calendar
Young businessman with a 2015 calendar — Stock Photo, Image
A man pressing a giant key with the number 2014, as the new year, with his hands
2014, as the new year, — Stock Photo, Image
A young caucasian businessman at his office desk full of charts shows a 2016 calendar
Young businessman with a 2016 calendar — Stock Photo, Image
Closeup of a young caucasian businessman at his office desk full of graphs and charts observing a forecast of economic growth for the year 2017 in his tablet computer
Man observing an economical forecast for 2017 in his tablet — Stock Photo, Image
A man wearing a suit sitting in a desk showing a signboard with the number 2014, as the new year, written in it
2014, as the new year — Stock Photo, Image
A young caucasian businessman celebrating the new year in his office observes a tablet computer with a tag cloud of goals for the 2016 for his company
Businessman with a tag cloud of goals for the 2016 — Stock Photo, Image
A young caucasian businessman sitting at his office desk full of charts watching his tablet computer with a tag cloud of goals for 2017 in its screen
Man with tag cloud of goals for 2017 in tablet — Stock Photo, Image
Closeup of a young caucasian man wearing a plaid shirt sitting at his desk showing a yellow sticky note with the text welcome 2016 written in it
Young man with a sticky note with the text welcome 2016 — Stock Photo, Image
A businessman with the number 2015, as the new year, in his hand
2015, as the new year — Stock Photo, Image
Man wearing a suit sitting in a table showing a graph of economic growth
Economic growth — Stock Photo, Image
Young man holding some white numbers forming the number 2016, as the new year, against a graded gray background, with a vignette added
Number 2016, as the new year — Stock Photo, Image
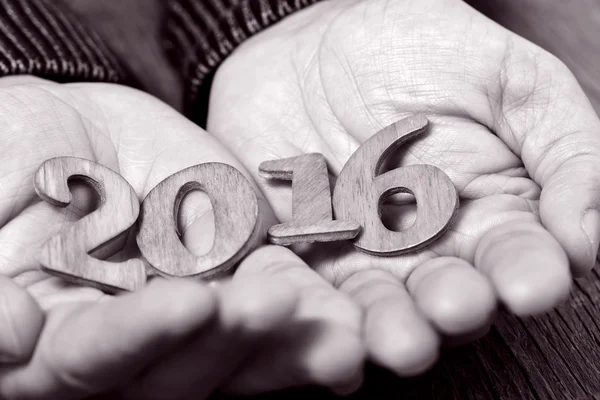
Closeup of wooden numbers forming the number 2016, as the new year, in the hands of a man, in black and white
2016, as the new year, in the hands of a man, duotone — Stock Photo, Image

Similar Stock Videos:

Business Statistics, Market Data And Infographics Layout Pack/ 4k animation of a set of design business and market data analysis and reports, with infographics, bar stats, charts and diagrams
Business Statistics Market Data Infographics Layout Pack Animation Set Design — Stock Video
Rotation of multi-colored diagrams. Analysis and statistics. Business background
Rotation of multi-colored diagrams. Analysis and statistics. — Stock Video
Business data graph chart drop down footage clip
Business Data Graph Chart Drop Footage Clip — Stock Video
Circle diagram for presentation, Pie chart indicated 10-90 percent, and various graphic diagram.
Circle diagram for presentation, Pie chart indicated 10 percent, and various graphic diagram. — Stock Video
Animation of analyzing graph information on computer screen
Animation Analyzing Graph Information Computer Screen — Stock Video
Pie chart indicated 10-90 percent, and various graphic diagram.
Circle diagram for presentation, Pie chart indicated 10 percent, and various graphic diagram. version 2 — Stock Video
Men's hands recalculate a pack of hundred-dollar bills
Men Hands Recalculate Pack Hundred Dollar Bills — Stock Video
Circle diagram for presentation, Pie chart indicated 10-90 percent, and various graphic diagram.
Circle diagram for presentation, Pie chart indicated 20 percent, and various graphic diagram. — Stock Video
Business Statistics, Market Data And Infographics Layout/ 4k animation of a set of design business and market data analysis and reports, with infographics, bar stats, charts and diagrams
Business Statistics Market Data Infographics Layout Animation Set Design Business — Stock Video
Business Statistics, Market Data And Infographics Layout/ 4k animation of a set of design business and market data analysis and reports, with infographics, bar stats, charts and diagrams
Business Statistics Market Data Infographics Layout Animation Set Design Business — Stock Video
Pie chart indicated 10-90 percent, and various graphic diagram.
Circle diagram for presentation, Pie chart indicated 20 percent, and various graphic diagram. version 2 — Stock Video
Pie chart indicated 10-90 percent, and various graphic diagram.
Circle diagram for presentation, Pie chart indicated 40 percent, and various graphic diagram. version 2 — Stock Video
Sheet with diagrams lying on a wooden table. Movement of the slider camera. Workplace on the table with data chart
Sheet with diagrams lying on a wooden table. Movement of the slider camera. — Stock Video
Businessman analyzing investment charts at his workplace
Businessman analyzing investment charts — Stock Video
Business Statistics, Market Data And Infographics Layout Pack/ 4k animation of a set of design business and market data analysis and reports, with infographics, bar stats, charts and diagrams
Business Statistics Market Data Infographics Layout Pack Animation Set Design — Stock Video
Circle diagram for presentation, Pie chart indicated 10-90 percent, and various graphic diagram.
Circle diagram for presentation, Pie chart indicated 80 percent, and various graphic diagram. — Stock Video
Pie chart indicated 10-90 percent, and various graphic diagram.
Circle diagram for presentation, Pie chart indicated 30 percent, and various graphic diagram. version 2 — Stock Video
Business Statistics, Market Data And Infographics Layout/ 4k animation of a set of design business and market data analysis and reports, with infographics, bar stats, charts and diagrams
Business Statistics Market Data Infographics Layout Animation Set Design Business — Stock Video

Usage Information

You can use this royalty-free photo "Economic forecast for 2015" for personal and commercial purposes according to the Standard or Extended License. The Standard License covers most use cases, including advertising, UI designs, and product packaging, and allows up to 500,000 print copies. The Extended License permits all use cases under the Standard License with unlimited print rights and allows you to use the downloaded stock images for merchandise, product resale, or free distribution.

You can buy this stock photo and download it in high resolution up to 4288x2848. Upload Date: Jan 7, 2015