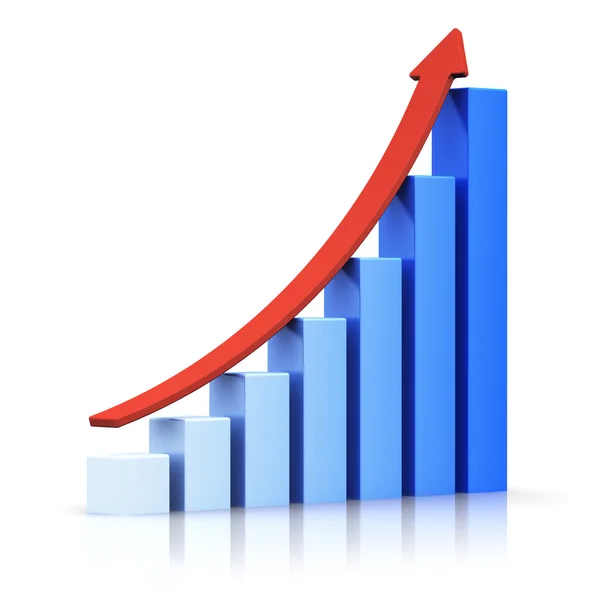
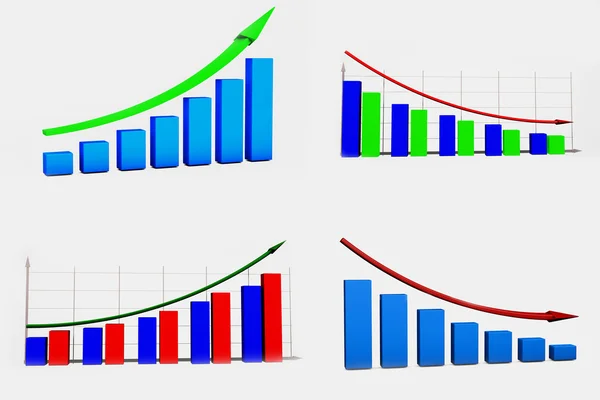
Growing bar chart with arrow
Growing bar chart with arrow — Stock Photo, Image
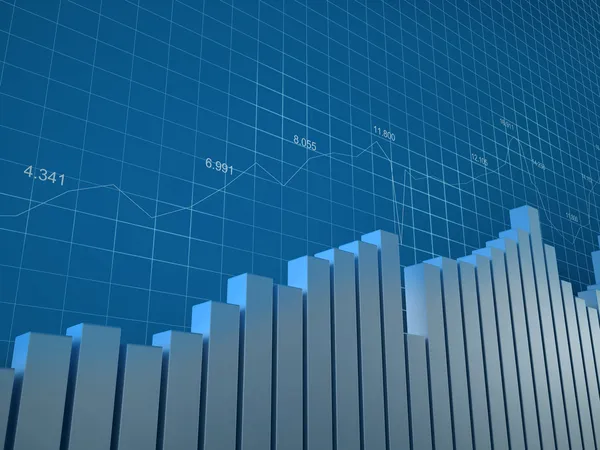
Statistics, Finance, Stock Exchange and Accounting business.
Statistics, Finance, Stock Exchange and Accounting business. — Stock Photo, Image
3d graph
3d graph — Stock Photo, Image
3d abstract metallic line with graph
3d abstract metallic line with graph — Stock Photo, Image
Highway bridges near Albuquerque new mexico

Highway bridges near Albuquerque new mexico — Stock Photo, Image

3d graph arrow blue
3d graph arrow blue — Stock Photo, Image
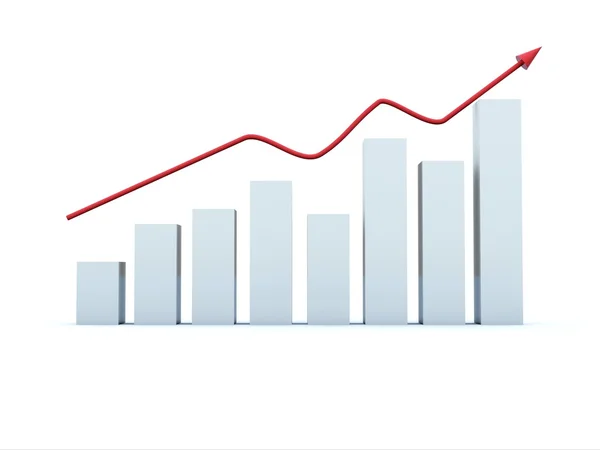
White graph with red arrow
White graph with red arrow — Stock Photo, Image
Knowledge Word Dictionary Definition Cirlced
Knowledge Word Dictionary Definition Cirlced — Stock Photo, Image
Business growth graph with rising arrow
Business growth graph with rising arrow — Stock Photo, Image
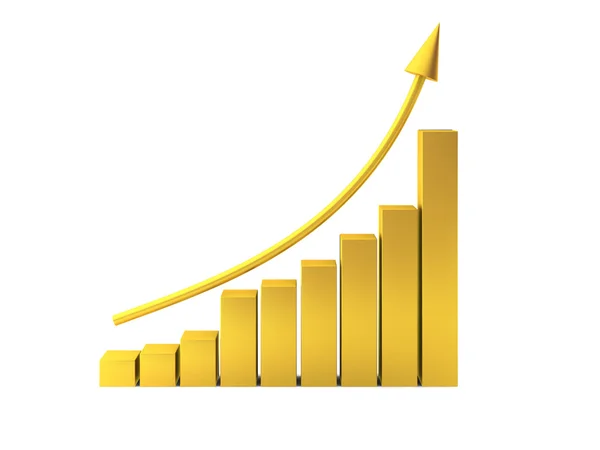
Golden Graph With Arrow
Golden Graph With Arrow — Stock Photo, Image
3d render of golden chart
3d render of golden chart — Stock Photo, Image
Businessman with financial chart symbols coming from hand
Businessman with financial chart symbols coming from hand — Stock Photo, Image
Modern financial analysis
Modern financial analysis — Stock Photo, Image
Financial review on table
Financial review on table — Stock Photo, Image
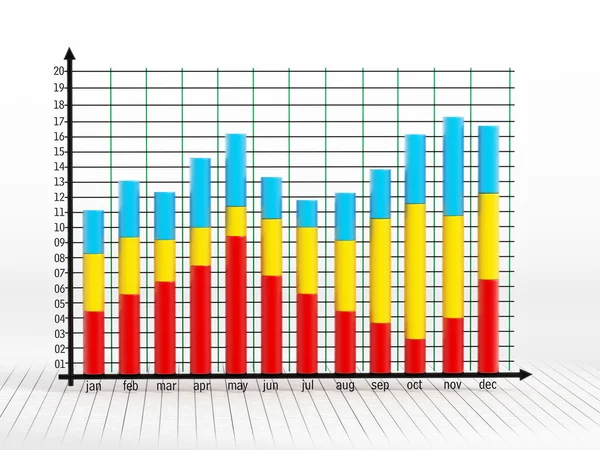
Bar graph
Bar graph — Stock Photo, Image
Many Pushing Up Green Arrow
Many Pushing Up Green Arrow — Stock Photo, Image
Close up of business tablet and diagrams
Close up of business tablet and diagrams — Stock Photo, Image
The Turquoise Trail
The Turquoise Trail — Stock Photo, Image
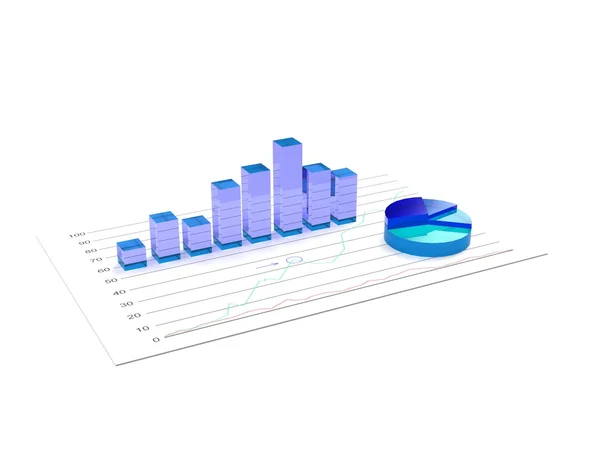
Bar graph and pie chart
Bar graph and pie chart — Stock Photo, Image
Businessman creating digital charts
Businessman creating digital charts — Stock Photo, Image
Bar graph and business objects on tablet pc
Bar graph and business objects on tablet pc — Stock Photo, Image
Financial statistics interface background
Financial Statistics Interface Background — Stock Photo, Image
City crash
City crash — Stock Photo, Image
Rising blue bar graph following the arrow on a background of a dotted world map. 3d render.
Rising Blue Bar Graph Arrow Background Dotted World Map Render — Stock Photo, Image
Blue Profit Chart
Blue Profit Chart — Stock Photo, Image
Piggy bank pink colour with money stack step up growing growth saving money, Concept financial business investment. Copy space for your text
Piggy Bank Pink Colour Money Stack Step Growing Growth Saving — Stock Photo, Image
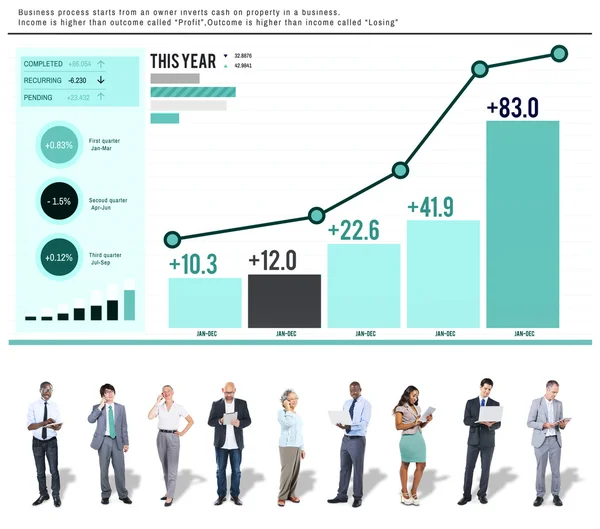
Diverse people and Bar Graph Concept
Diverse people and Bar Graph Concept — Stock Photo, Image
Man drawing charts side
Man drawing charts side — Stock Photo, Image
Diagram projection on digital tablet
Diagram Projection Digital Tablet — Stock Photo, Image
Business graph
Business graph — Stock Photo, Image
Business successful bar graph growth
Business successful bar graph growth — Stock Photo, Image
Man Smartphone Illustrating Ascending Trends Performance Bar Graph Increasing Annual Profits. Showing Upward Growth Escalating Movement Rising Financial Stock Chart Status Report.
Man Smartphone Illustrating Ascending Trends Performance Bar Graph Increasing Annual Profits. Showing Upward Growth Escalating Movement Rising Financial Stock Chart Status Report. — Stock Photo, Image
3D graph to growth
3D graph to growth — Stock Photo, Image
Businessman drawing a rising arrow
Businessman drawing a rising arrow — Stock Photo, Image
Finance and accounting concept
Finance and accounting concept — Stock Photo, Image
Organize data with technology
Organize data with technology — Stock Photo, Image
Computer tablet with a bar graph
Computer tablet with a bar graph — Stock Photo, Image
Bar chart
Bar chart — Stock Photo, Image
Blue grafic down
Blue grafic down — Stock Photo, Image
Businesswoman with bar graph.
Businesswoman with bar graph. — Stock Photo, Image
Growing bar graphs and pie chart
Growing bar graphs and pie chart — Stock Photo, Image
Red rising arrow graph
Red rising arrow graph — Stock Photo, Image
Business graph
Business graph — Stock Photo, Image
Statistics Data Analysis s Concept
Statistics Data Analysis s Concept — Stock Photo, Image
Digital composite of Interface overlay of connection statistics graphics with charts transition
Digital Composite Interface Overlay Connection Statistics Graphics Charts Transition — Stock Photo, Image
Business graph with green bars at the beginning and end
Business graph with green bars at the beginning and end — Stock Photo, Image
Businessman drawing a rising arrow
Businessman drawing a rising arrow — Stock Photo, Image
Hand drawn bar graph with various water colors
Hand drawn bar graph with various water colors — Stock Photo, Image
Hand drawing bar graph
Hand drawing bar graph — Stock Photo, Image
Bar Graph, Analysis Strategy Concept
Bar Graph, Analysis Strategy Concept — Stock Photo, Image
Chart on white background
Chart on white background — Stock Photo, Image
Home finances concept
Home finances concept — Stock Photo, Image
Coins piled
Coins piled — Stock Photo, Image
Pencil with the diagramme
Pencil with the diagramme — Stock Photo, Image
Digital charts illustration
Digital charts illustration — Stock Photo, Image
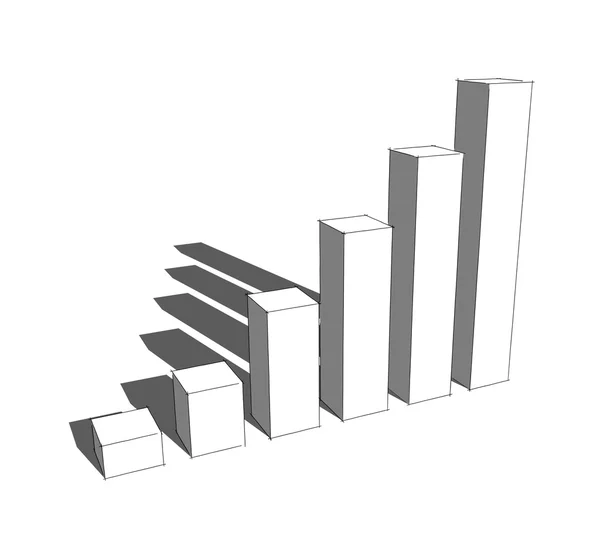
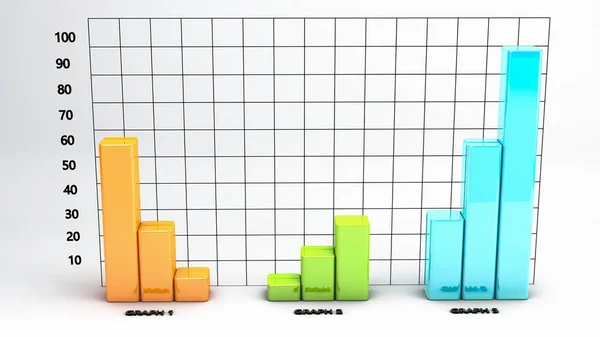
3d bar graph
3d bar graph — Stock Photo, Image
Grey cylinders as a graph
Grey cylinders as a graph — Stock Photo, Image
3d blank bar graph template. bar chart mockup. data analysis. colorful statistic bar chart with clipping path. 3d illustration.
Blank Bar Graph Template Bar Chart Mockup Data Analysis Colorful — Stock Photo, Image
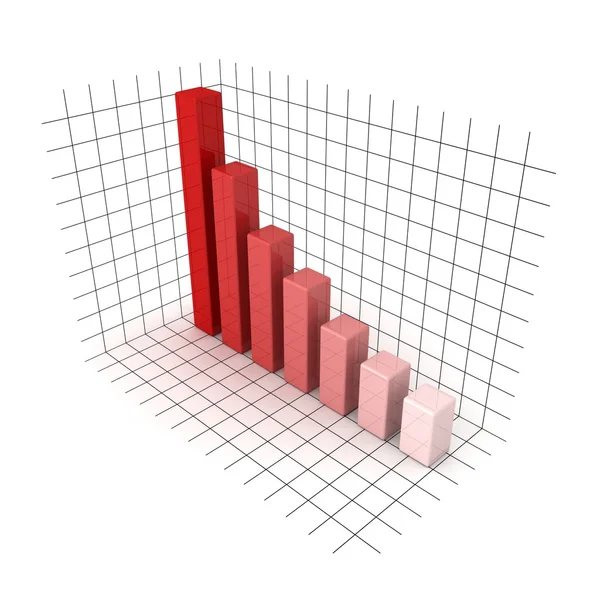
3D red business bar chart graph on white background
3D red business bar chart graph on white background — Stock Photo, Image
Close up view of white flipchart with growth graphic isolated on yellow
Close View White Flipchart Growth Graphic Isolated Yellow — Stock Photo, Image
Minimal ecru jute plain horizontal stripe texture pattern. Two tone washed out beach decor background. Modern rustic brown sand color design. Seamless striped distress shabby chic pattern.
Minimal ecru jute plain horizontal stripe texture pattern. Two tone washed out beach decor background. Modern rustic brown sand color design. Seamless striped distress shabby chic pattern. — Stock Photo, Image
Fiscal management which can easily modify or edit
Fiscal Management Which Can Easily Modify Edit — Stock Photo, Image
Cut paper in the shape of charts. Business concept
Cut Paper Shape Charts Business Concept — Stock Photo, Image
Striped background. Presentation business desing template banner. Perfect for wallpaper or webdesign
Striped Background Presentation Business Desing Template Banner Perfect Wallpaper Webdesign — Stock Photo, Image
Cake statistics
Cake statistics — Stock Photo, Image
White cylindric bar diagram on the black background. Infographic mockup. 3D render illustration
White Cylindric Bar Diagram Black Background Infographic Mockup Render Illustration — Stock Photo, Image
Business graph analysis report
Business graph analysis report — Stock Photo, Image
An abstract that represents a fire wall that blocks the way. 3D rendering.
Abstract Represents Fire Wall Blocks Way Rendering — Stock Photo, Image
Graph, chart, 3d illustration
Graph, chart, 3d illustration — Stock Photo, Image
Business Graph
Business Graph — Stock Photo, Image
International paper B series
International paper B series — Stock Photo, Image
3d minimal bar chart icon. data analysis. 5 color bar graph. 3d illustration. clipping path included.
Minimal Bar Chart Icon Data Analysis Color Bar Graph Illustration — Stock Photo, Image
Sales chart
Sales chart — Stock Photo, Image
Continuous white wooden lattice pattern
Continuous White Wooden Lattice Pattern — Stock Photo, Image
Bar chart decrease icon
Bar chart decrease icon — Stock Photo, Image
Mosaic tile wall seamless
Mosaic tile wall seamless — Stock Photo, Image
Black chart
Black chart — Stock Photo, Image
Business success and growth graph
Business success and growth graph — Stock Photo, Image
Isometric hand drawn infographic element isoolated on white.
Isometric hand drawn infographic element isoolated on white. — Stock Photo, Image
White bar diagram on black background. Infographic mockup. 3D render illustration
White Bar Diagram Black Background Infographic Mockup Render Illustration — Stock Photo, Image
Bars
Bars — Stock Photo, Image
Upturn
Upturn — Stock Photo, Image
Black bar diagram on black background. Infographic mockup. 3D render illustration
Black Bar Diagram Black Background Infographic Mockup Render Illustration — Stock Photo, Image
Beige color graphic illustration, abstract bright nude sketch background
Beige Color Graphic Illustration Abstract Bright Nude Sketch Background — Stock Photo, Image
Chart, cartoon style graph of indicators. Indicator bars of different colors..
Chart Cartoon Style Graph Indicators Indicator Bars Different Colors — Stock Photo, Image
Math paper, background
Math paper, background — Stock Photo, Image
Growth
Growth — Stock Photo, Image
3D rendering Business 3d graph infographics chart
Rendering Business Graph Infographics Chart — Stock Photo, Image
Financial graphics diagram for work business
Financial graphics diagram for work business — Stock Photo, Image
Hand drawn doodle text box collection for business system concep
Hand drawn doodle text box collection for business system concep — Stock Photo, Image
Art color graph illustration background
Art Color Graph Illustration Background — Stock Photo, Image
A 3D render of a growing business chart
Render Growing Business Chart — Stock Photo, Image
Growth chart
Growth chart — Stock Photo, Image
Graph paper texture for background or decoration concept
Graph paper texture for background or decoration concept — Stock Photo, Image
White cylindric bar diagram on the white background. Infographic mockup. 3D render illustration
White Cylindric Bar Diagram White Background Infographic Mockup Render Illustration — Stock Photo, Image
Coins and bars graph concept showing finance, investment, business, stock rise and fall. 3D rendering
Coins Bars Graph Concept Showing Finance Investment Business Stock Rise — Stock Photo, Image
Graph of profit
Graph of profit — Stock Photo, Image
Drawing empty diagram
Drawing empty diagram — Stock Photo, Image
High-definition geometry texture repeat pattern on a creative texture surface
High Definition Geometry Texture Repeat Pattern Creative Texture Surface — Stock Photo, Image
White vintage brickwall
White vintage brickwall — Stock Photo, Image

Related image searches

Bar Graph Images - A Selection of Visuals to Enhance Your Project

When it comes to presenting data and statistics, nothing beats the power of a well-crafted bar graph. The combination of visual and numerical information helps to convey complex information in a way that is easy to understand. Our stock image library boasts an impressive collection of bar graph images of various types and styles to suit your project needs.

Types of Bar Graph Images Available

We have a diverse range of bar graph images available, including vertical bar graphs, horizontal bar graphs, stacked bar graphs, and clustered bar graphs. Each graph type has its unique properties and can be used to visualize different types of data.

For instance, vertical bar graphs are great for comparing data sets, while horizontal bar graphs are useful for presenting data in a chronological order. Stacked bar graphs, on the other hand, are best for showing how different parts contribute to the whole, while clustered bar graphs are ideal for comparing multiple categories across multiple data points.

Our variety of bar graph images ensures that you can find the perfect visual aid for your project, regardless of the type of data you need to present.

Where Bar Graph Images Can be Used

Bar graph images are versatile visuals that can be used in a range of contexts, from business reports and presentations to educational materials and infographics. They can help you communicate your message effectively and with impact, making your work more professional and engaging.

If you're involved in marketing, bar graph images can be used to showcase your brand's success or performance metrics, which can be particularly compelling for investors or potential clients. In the education sector, bar graphs can be used to present research data or student performance information in a way that is easy to absorb and understand.

How to Use Bar Graph Images Effectively

While bar graph images are powerful visual aids, it's essential to use them appropriately to avoid overwhelming your audience. Here are some tips to help you use bar graph images effectively:

  • Choose the right graph type for your data
  • Keep the colors and design simple to avoid distractions
  • Use appropriate labeling to add context and information
  • Scale the axis correctly to represent the data accurately
  • Use percentages or other relevant measures to assist with data interpretation

By following these guidelines, you can create compelling and informative bar graph images that are sure to impress your audience.

Conclusion

Whether you're presenting data in a business meeting or educational material, bar graph images are a powerful visual tool that can help convey your message in a clear and concise way. Our collection of stock bar graph images offers a wide range of styles and types to suit your project's needs. Remember to use them effectively, and you'll be sure to leave a lasting impression.