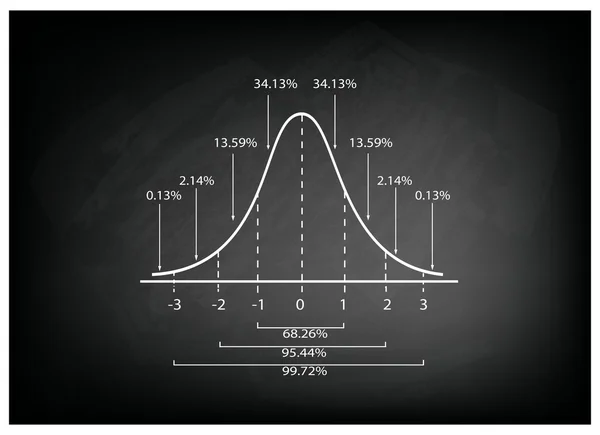
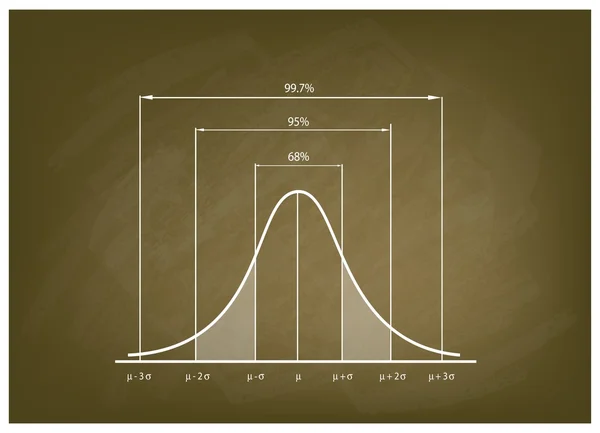
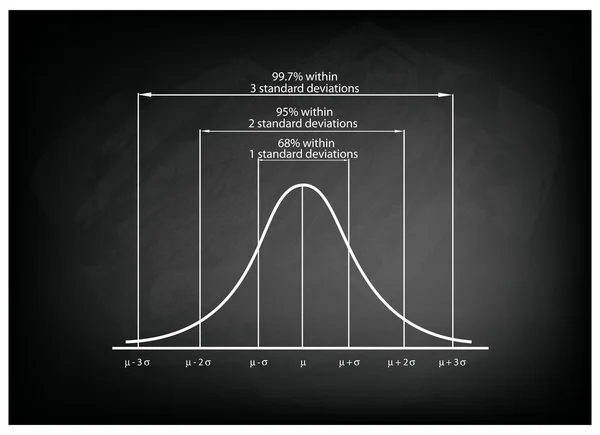
Normal Distribution Diagram or Bell Curve Chart on Blackboard — Stock Vector

Normal Distribution Diagram or Bell Curve Chart on Blackboard — Vector

Business and Marketing Concepts, Illustration of Gaussian, Bell or Normal Distribution Diagram on Chalkboard Background

 — Vector by Iamnee

Same Series:

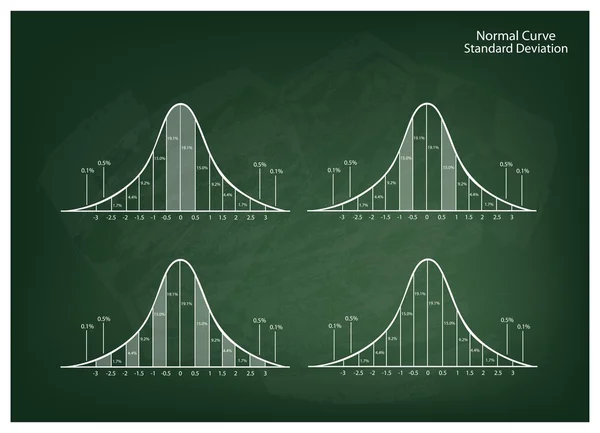
Business and Marketing Concepts, Illustration Set of Gaussian Bell Curve or Normal Distribution Curve on Green Chalkboard Background.
Collection of Normal Distribution Diagram on Green Chalkboard Background — Stock Vector
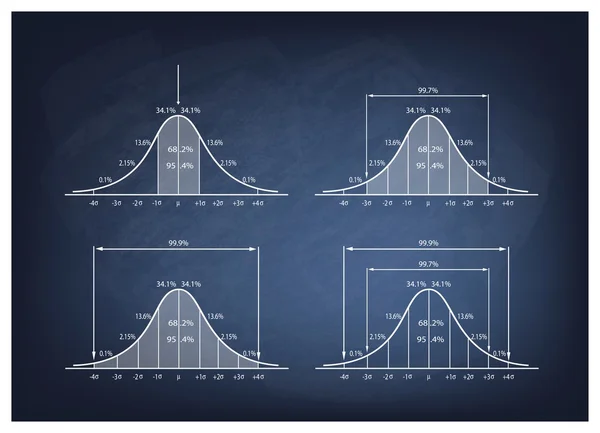
Illustration Set of Standard Deviations Gaussian Bell or Normal Distribution Curve Graph.
Collection of 4 Standard Normal Distribution Curve Chrat — Stock Vector
Business and Marketing Concepts, Illustration Set of Gaussian Bell Curve or Normal Distribution Curve on Black Chalkboard Background.
Collection of Normal Distribution Diagram on Black Chalkboard Background — Stock Vector
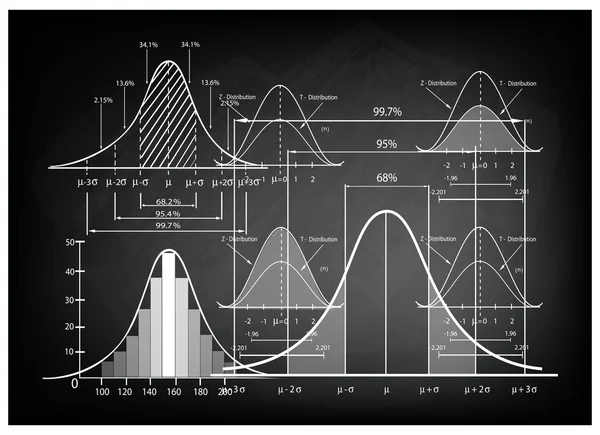
Business and Marketing Concepts, Illustration of Standard Deviation Diagram, Gaussian Bell or Normal Distribution Curve Population Pyramid Chart for Sample Size Determination
Standard Deviation Diagram with Sample Size Chart — Stock Vector
Business and Marketing Concepts, Illustration of Gaussian Bell Diagram or Normal Distribution Curve on Black Chalkboard Background.
Normal Distribution Curve Diagram on Chalkboard Background — Stock Vector
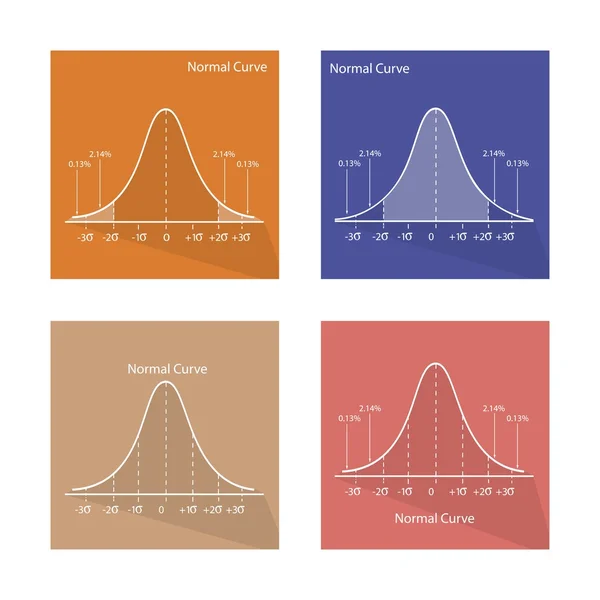
Business and Marketing Concepts, Illustration Set of 4 Gaussian Bell or Normal Distribution Curve on Old Antique Vintage Grunge Paper Texture Background.
Normal Distribution Curve on Old Paper Background — Stock Vector
Business and Marketing Concepts, Illustration Collection of 4 Gaussian Bell Curve or Normal Distribution Curve on Green Chalkboard Background.
Set of Normal Distribution Diagram on Green Chalkboard Background — Stock Vector
Business and Marketing Concepts, Illustration of Standard Deviation, Gaussian Bell or Normal Distribution Curve on A Chalkboard Background
Normal Distribution Chart or Gaussian Bell Curve on Chalkboard — Stock Vector
Business and Marketing Concepts, Illustration of Standard Deviation Diagram Chart, Gaussian Bell Graph or Normal Distribution Curve on Old Antique Vintage Grunge Paper Texture Background.
Normal Distribution Diagram on Old Paper Background — Stock Vector
Business and Marketing Concepts, Illustration of Standard Deviation Diagram, Gaussian Bell or Normal Distribution Curve on Black Chalkboard Background.
Standard Deviation Diagram Chart on Black Chalkboard Background — Stock Vector
Business and Marketing Concepts, Illustration Collection of 4 Gaussian Bell Curve Diagram or Normal Distribution Curve on Old Antique Vintage Grunge Paper Texture Background.
Set of Normal Distribution Chart on Old Paper Background — Stock Vector
Business and Marketing Concepts, Illustration of Standard Deviation, Gaussian Bell or Normal Distribution Curve on Old Antique Vintage Grunge Paper Texture Background.
Normal Distribution or Gaussian Bell Curve on Old Paper Background — Stock Vector
Business and Marketing Concepts, Illustration Collection of Gaussian Bell Curve Diagram or Normal Distribution Curve on A Chalkboard Background.
Set of Standard Deviation Chart on Chalkboard Background — Stock Vector
Business and Marketing Concepts, Illustration Collection of Gaussian Bell Curve Chart or Normal Distribution Curve Graph on Blackboard Background.
Set of Normal Distribution Diagram on Blackboard Background — Stock Vector
Business and Marketing Concepts, Illustration of Standard Deviation, Gaussian Bell or Normal Distribution Curve on Old Antique Vintage Grunge Paper Texture Background.
Normal Distribution or Gaussian Bell Curve on Old Paper Background — Stock Vector
Business and Marketing Concepts, Illustration of Standard Deviation Diagram, Gaussian Bell or Normal Distribution Curve on A Chalkboard Background.
Standard Deviation Diagram on A Chalkboard Background — Stock Vector

Similar Stock Videos:

White line Pie chart infographic icon isolated on black background. Diagram chart sign. 4K Video motion graphic animation
White line Pie chart infographic icon isolated on black background. Diagram chart sign. 4K Video motion graphic animation — Stock Video
White line Pie chart infographic icon isolated on black background. Diagram chart sign. 4K Video motion graphic animation.
White line Pie chart infographic icon isolated on black background. Diagram chart sign. 4K Video motion graphic animation — Stock Video
White line Graph, schedule, chart, diagram, infographic, pie graph icon isolated on black background. 4K Video motion graphic animation
White line Graph, schedule, chart, diagram, infographic, pie graph icon isolated on black background. 4K Video motion graphic animation — Stock Video
White line Pie chart infographic icon isolated on black background. Diagram chart sign. 4K Video motion graphic animation.
White line Pie chart infographic icon isolated on black background. Diagram chart sign. 4K Video motion graphic animation — Stock Video
Chalk graph chart diagram, video animation business blackboard
Chalk graph chart diagram, video animation — Stock Video
White line Financial growth decrease icon isolated on black background. Increasing revenue. 4K Video motion graphic animation.
White line Financial growth decrease icon isolated on black background. Increasing revenue. 4K Video motion graphic animation — Stock Video
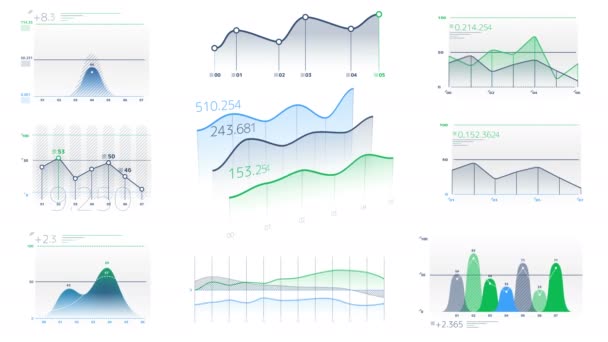
Several color graphs animated on the white background.
Color infographics on the white background — Stock Video
White Graph, schedule, chart, diagram, infographic, pie graph icon isolated on green background. 4K Video motion graphic animation.
White Graph, schedule, chart, diagram, infographic, pie graph icon isolated on green background. 4K Video motion graphic animation — Stock Video
White Pie chart infographic icon isolated on green background. Diagram chart sign. 4K Video motion graphic animation.
White Pie chart infographic icon isolated on green background. Diagram chart sign. 4K Video motion graphic animation — Stock Video
Money, finance and payments. Set outline web icon. Motion graphics
Money, finance and payments. Set outline web icon. Motion graphics. — Stock Video
4k Business Data Graph,Financial figures and diagrams showing increasing profits.
Business Data Graph Financial Figures Diagrams Showing Increasing Profits — Stock Video
Infographics of sales rising up after Corona virus COVID-19.
Infographics Sales Rising Corona Virus Covid — Stock Video
White line Financial growth and coin icon isolated on black background. Increasing revenue. 4K Video motion graphic animation
White line Financial growth and coin icon isolated on black background. Increasing revenue. 4K Video motion graphic animation — Stock Video
Infographics of sales dropping down affected by Corona virus COVID-19.
Infographics Sales Dropping Affected Corona Virus Covid — Stock Video
Several animated graphs without any data.
Animated infographic elements without data — Stock Video
Data report bar graph and line graph chart animated. Grow or success profit diagram concept. Available in 4K FullHD and HD video
Data report bar graph and line graph chart animated — Stock Video
Infographics of production dropping down affected by Corona virus COVID-19.
Infographics Production Dropping Affected Corona Virus Covid — Stock Video
Business line shadow icon. Marketing network. Money line icon. Motion graphics
Business line shadow icon. Marketing network. Money line icon. Motion graphics. — Stock Video

Usage Information

You can use this royalty-free vector image "Normal Distribution Diagram or Bell Curve Chart on Blackboard" for personal and commercial purposes according to the Standard or Extended License. The Standard License covers most use cases, including advertising, UI designs, and product packaging, and allows up to 500,000 print copies. The Extended License permits all use cases under the Standard License with unlimited print rights and allows you to use the downloaded vector files for merchandise, product resale, or free distribution.

This stock vector image is scalable to any size. You can buy and download it in high resolution up to 6917x5000. Upload Date: Aug 22, 2016