Ionic Bonding Infographic Diagram Example Ionic Bond Lithium Fluorine Atoms — Stock Vector

Ionic bonding infographic diagram with example of Ionic bond between lithium and fluorine atoms showing ionization energy and electron affinity for chemistry science education — Vector

Ionic bonding infographic diagram with example of Ionic bond between lithium and fluorine atoms showing ionization energy and electron affinity for chemistry science education

 — Vector by udaix

Same Series:

Electronegativity infographic diagram with example of sodium chloride showing how chlorine atom pull electron table related to bond forming due to electronegativity difference for chemistry education
Electronegativity Infographic Diagram Example Sodium Chloride Showing How Chlorine Atom — Stock Vector
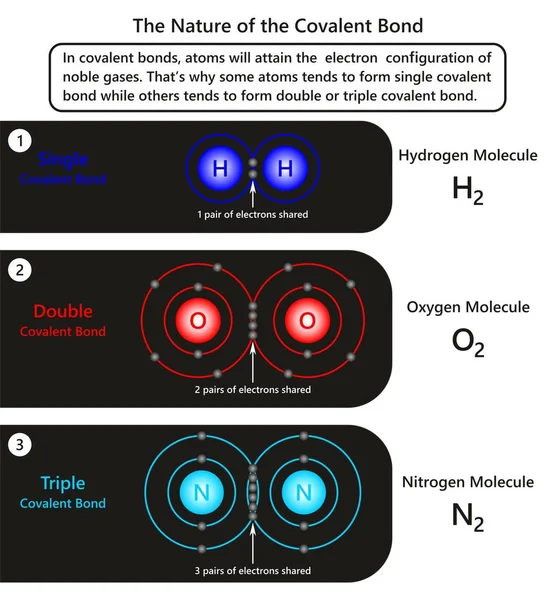
The Nature of the Covalent Bond infographic diagram showing examples of atoms in covalent bond how some of them tend to form single bond while others make double or triple for chemistry science
Nature Covalent Bond Infographic Diagram Showing Examples Atoms Covalent Bond — Stock Vector
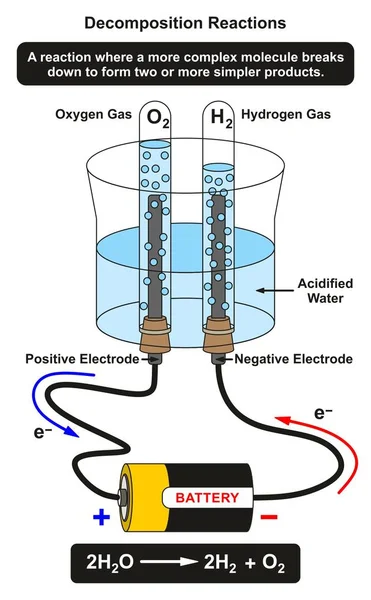
Decomposition Reactions infographic diagram with lab experiment showing example of water molecule breaking down in to oxygen and hydrogen gases for chemistry science education
Decomposition Reactions Infographic Diagram Lab Experiment Showing Example Water Molecule — Stock Vector
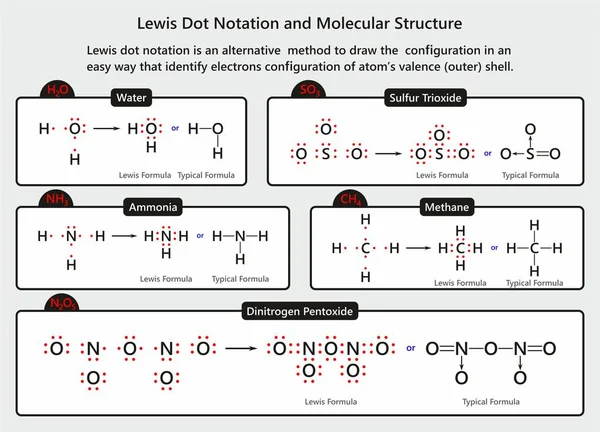
Lewis Dot Notation and Molecular Structure infographic diagram with examples of water ammonia methane sulfur trioxide and dinitrogen pentoxide molecules for chemistry science education
Lewis Dot Notation Molecular Structure Infographic Diagram Examples Water Ammonia — Stock Vector
Oxidation and Reduction Process infographic diagram with an example of redox reaction between two atoms one of them get oxidized loses an electron while other get reduced gains an electron for chemistry education
Oxidation Reduction Process Infographic Diagram Example Redox Reaction Two Atoms — Stock Vector
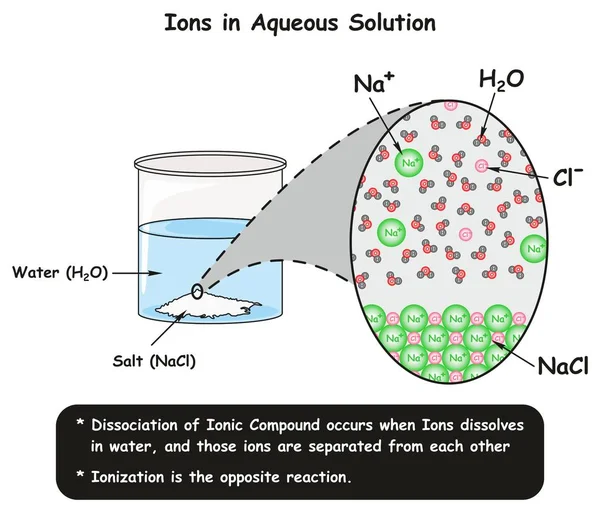
Ions in Aqueous Solution infographic diagram showing dissociation reaction of sodium chloride crystals in water and how ions separated for chemistry science education
Ions Aqueous Solution Infographic Diagram Showing Dissociation Reaction Sodium Chloride — Stock Vector
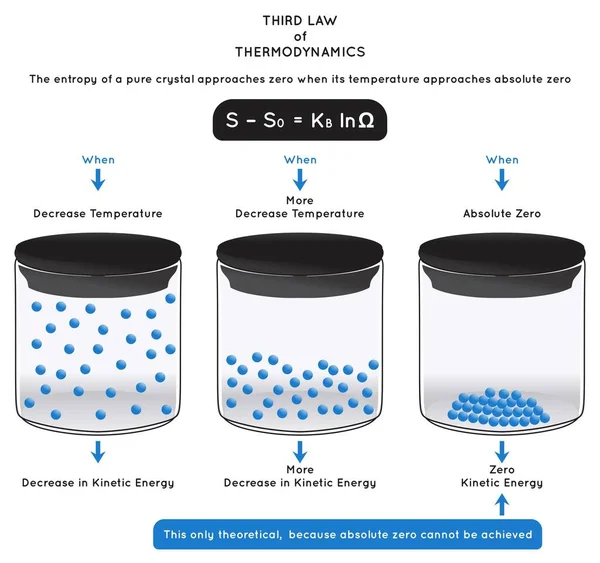
Third Law of Thermodynamics Infographic Diagram showing relation between decreasing temperature and kinetic energy till absolute zero for physics science education poster vector
Third Law Thermodynamics Infographic Diagram Showing Relation Decreasing Temperature Kinetic — Stock Vector
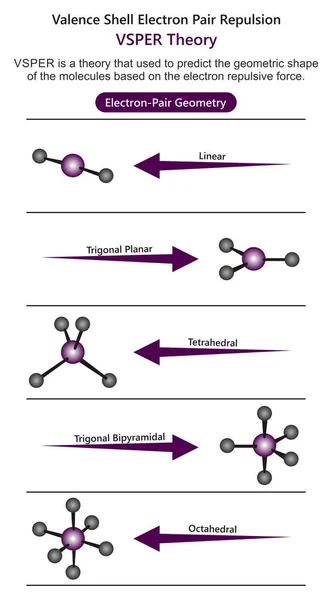
Valence Shell Electron Pair Repulsion VSPER Theory infographic diagram showing prediction of geometric shape of molecules based on electron repulsive force for chemistry science education
Valence Shell Electron Pair Repulsion Vsper Theory Infographic Diagram Showing — Stock Vector
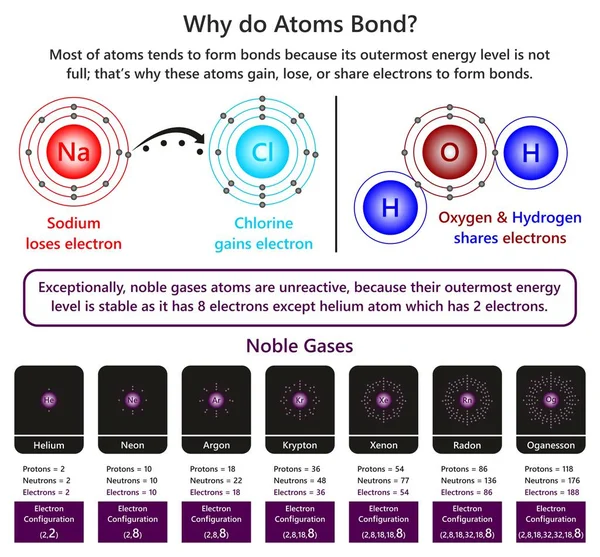
Why do Atoms Bond infographic diagram showing example of sodium and chlorine ions forming ionic bond also in water molecule oxygen and hydrogen forming covalent bond and nature of unreactive noble gases
Why Atoms Bond Infographic Diagram Showing Example Sodium Chlorine Ions — Stock Vector
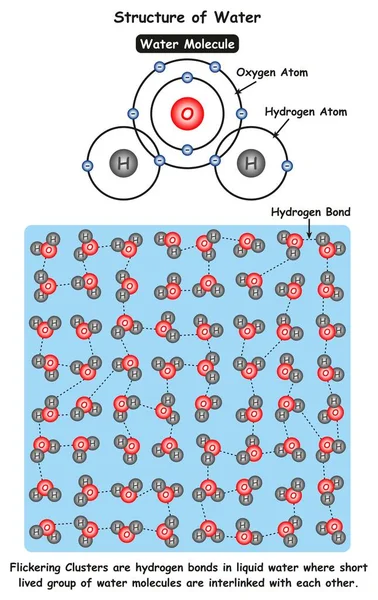
Structure of Water infographic diagram showing molecule of water and ionic bonds between oxygen and hydrogen atoms also microscopic view showing flickering clusters for chemistry science education
Structure Water Infographic Diagram Showing Molecule Water Ionic Bonds Oxygen — Stock Vector
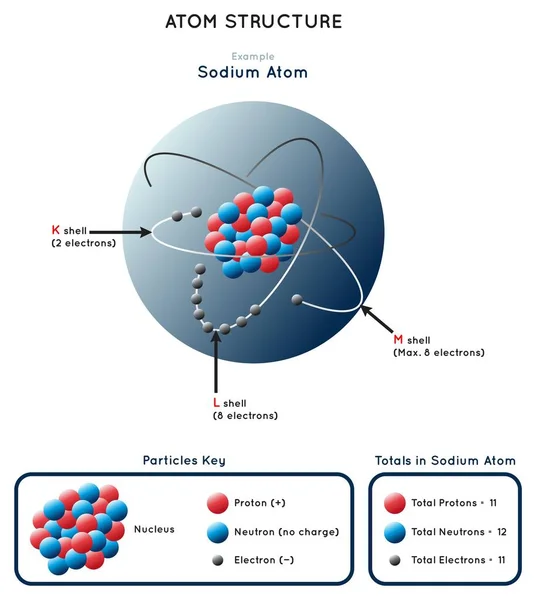
Atom Structure Infographic Diagram showing example of sodium atom including shells nucleus protons neutrons electrons with particle key and totals in sodium atom for chemistry science education vector
Atom Structure Infographic Diagram Showing Example Sodium Atom Including Shells — Stock Vector
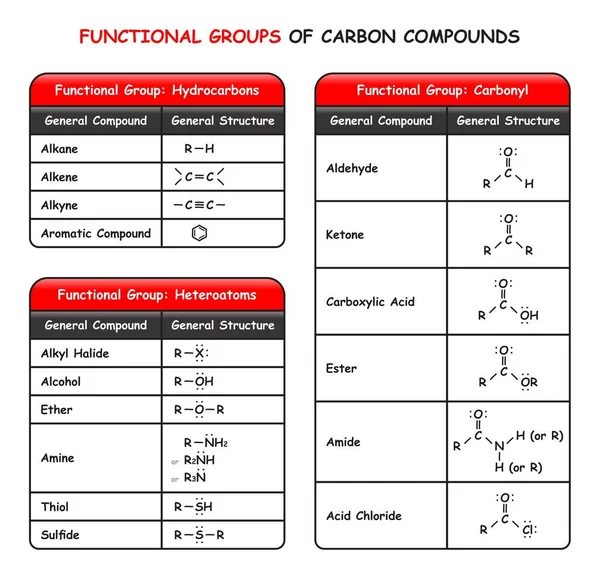
Functional Groups of Carbon Compounds Infographic Diagram including hydrocarbons heteroatoms and carbonyl with general compound and structure for chemistry science education poster vector
Functional Groups Carbon Compounds Infographic Diagram Including Hydrocarbons Heteroatoms Carbonyl — Stock Vector
Chemical Equation Infographic diagram showing identities and quantities of reactants products example of methane and oxygen reaction resulting with carbon dioxide water for chemistry science education vector
Chemical Equation Infographic Diagram Showing Identities Quantities Reactants Products Example — Stock Vector
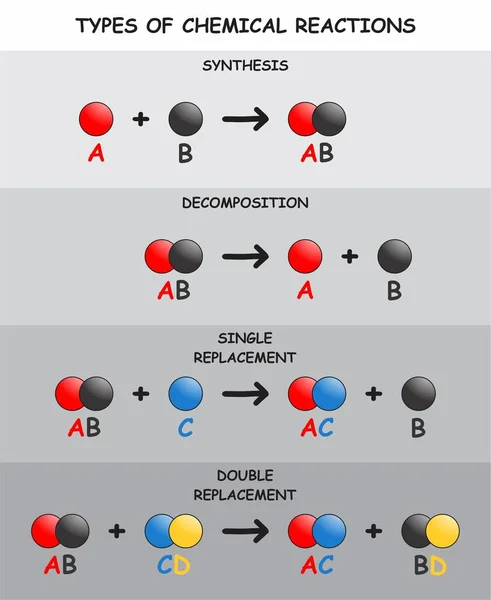
Types of Chemical Reactions Infographic Diagram including synthesis decomposition single and double replacement for chemistry science education poster vector
Types Chemical Reactions Infographic Diagram Including Synthesis Decomposition Single Double — Stock Vector
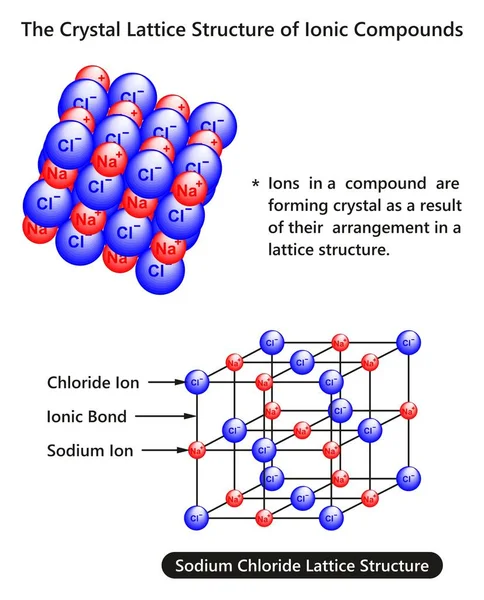
The Crystal Lattice Structure of Ionic Compounds infographic diagram with example of sodium chloride substance for chemistry science education
Crystal Lattice Structure Ionic Compounds Infographic Diagram Example Sodium Chloride — Stock Vector
Redox Reaction Infographic Diagram with example of manganese dioxide reacting with hydrochloric acid producing manganese chloride chlorine and water for chemistry science education poster vector
Redox Reaction Infographic Diagram Example Manganese Dioxide Reacting Hydrochloric Acid — Stock Vector

Similar Stock Videos:

Collection of infographic elements in the popular line style.
Infographic Elements In The Line Style. Yellow Spot — Stock Video
Corporate infographic elements bundle. Can be used for workflow, startup, business success, diagram, presentation, banner, teamwork, design, infographic elements set information infographics
Corporate Infographic Elements — Stock Video
Blue corporate infographic elements bundle. Can be used for workflow, startup, business success, diagram, presentation, banner, teamwork, design, infographic elements, set information infographics
Blue Corporate Infographic Elements — Stock Video
Blue corporate infographic elements bundle. Can be used for workflow, startup, business success, diagram, presentation, banner, teamwork, design, infographic elements, set information infographics
Blue Corporate Infographic Elements — Stock Video
Corporate infographic elements bundle. Can be used for workflow, startup, business success, diagram, presentation, banner, teamwork, design, infographic elements set information infographics
Corporate Infographic Elements — Stock Video
Blue corporate infographic elements bundle. Can be used for workflow, startup, business success, diagram, presentation, banner, teamwork, design, infographic elements, set information infographics
Blue Corporate Infographic Elements — Stock Video
Colorful corporate infographic elements bundle. Can be used for workflow, startup, business success, diagram, presentation, banner, teamwork, design, infographic elements set information infographics
Colorful Corporate Infographic Elements — Stock Video
Corporate infographic elements bundle. Can be used for workflow, startup, business success, diagram, presentation, banner, teamwork, design, infographic elements set information infographics
Corporate Infographic Elements — Stock Video
Several decorative infographic schemes are made on the white background.
Large infographic schemes on the white background — Stock Video
Colorful corporate infographic elements bundle. Can be used for workflow, startup, business success, diagram, presentation, banner, teamwork, design, infographic elements set information infographics
Colorful Corporate Infographic Elements — Stock Video
Colorful corporate infographic elements bundle. Can be used for workflow, startup, business success, diagram, presentation, banner, teamwork, design, infographic elements set information infographics
Colorful Corporate Infographic Elements — Stock Video
Spanish. Mouse Cursor Slides Over And Clicks No in Response to Are You Sure? on Web Page. Device Screen View of Cursor Clicking Unsure Online. Viewpoint Over The Internet Network Website.
Spanish Mouse Cursor Slides Clicks Response You Sure Web Page — Stock Video
Room for a custom logo in the upper left corner of the screen. Titles are of fictional shows.
Simulation of an on-screen interactive television guide menu from a cable or satellite company. — Stock Video
Corporate infographic elements bundle. Can be used for workflow, startup, business success, diagram, presentation, banner, teamwork, design, infographic elements set information infographics
Corporate Infographic Elements — Stock Video

Usage Information

You can use this royalty-free vector image "Ionic bonding infographic diagram with example of Ionic bond between lithium and fluorine atoms showing ionization energy and electron affinity for chemistry science education" for personal and commercial purposes according to the Standard or Extended License. The Standard License covers most use cases, including advertising, UI designs, and product packaging, and allows up to 500,000 print copies. The Extended License permits all use cases under the Standard License with unlimited print rights and allows you to use the downloaded vector files for merchandise, product resale, or free distribution.

This stock vector image is scalable to any size. You can buy and download it in high resolution up to 1697x2441. Upload Date: Aug 18, 2018