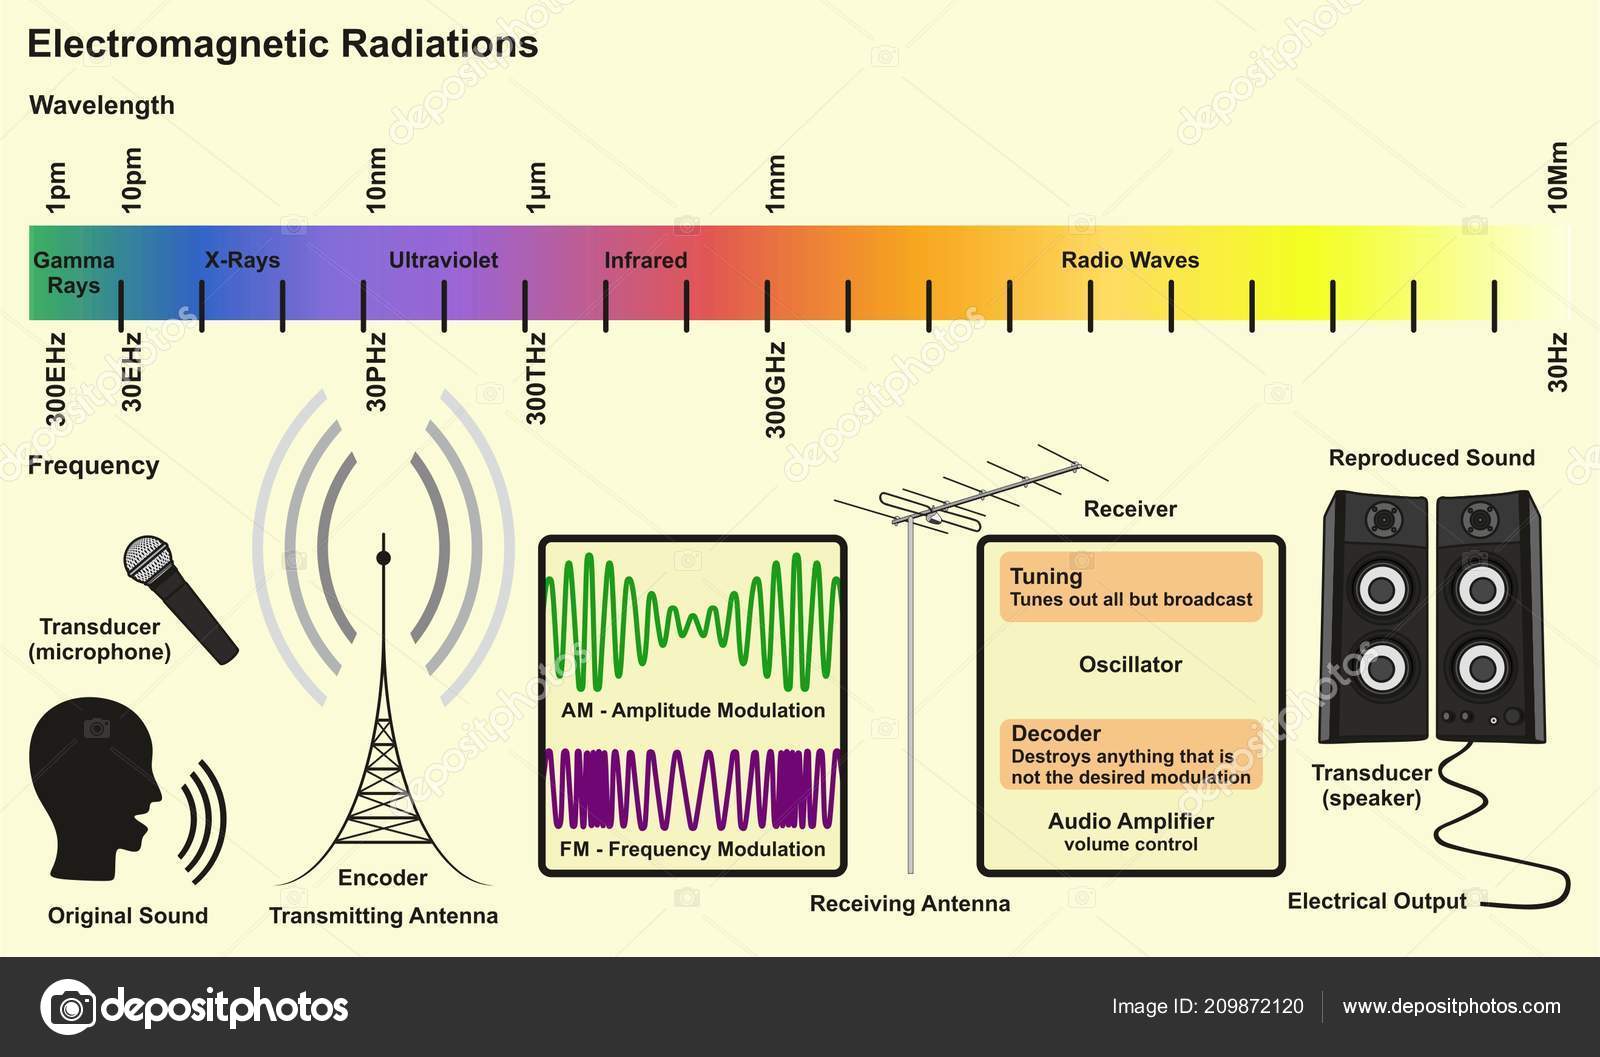
Electromagnetic Spectrum Sources Infographic Diagram Radiations Gamma Ray Xray Ultraviolet — Stock Vector

Electromagnetic Spectrum Sources infographic diagram with radiations of gamma ray xray ultraviolet infrared radio waves wavelength frequency examples for communication science education — Vector

Electromagnetic Spectrum Sources infographic diagram with radiations of gamma ray xray ultraviolet infrared radio waves wavelength frequency examples for communication science education

 — Vector by udaix

Same Series:

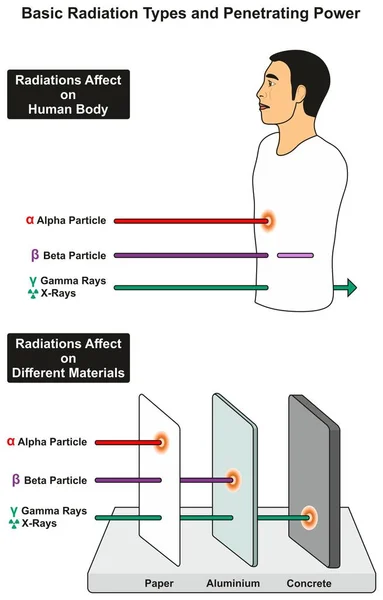
Basic Radiation Types and Penetrating Power infographic Diagram with example of its affect on human body and different materials including alpha beta particles gamma ray xray for science education
Basic Radiation Types Penetrating Power Infographic Diagram Example Its Affect — Stock Vector
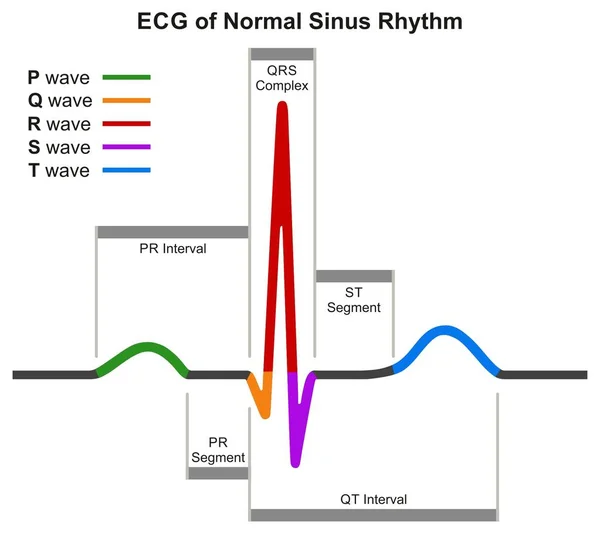
ECG of Normal Sinus Rhythm infographic diagram showing normal heart beat wave including intervals segments and complex for medical science education and health care
Ecg Normal Sinus Rhythm Infographic Diagram Showing Normal Heart Beat — Stock Vector
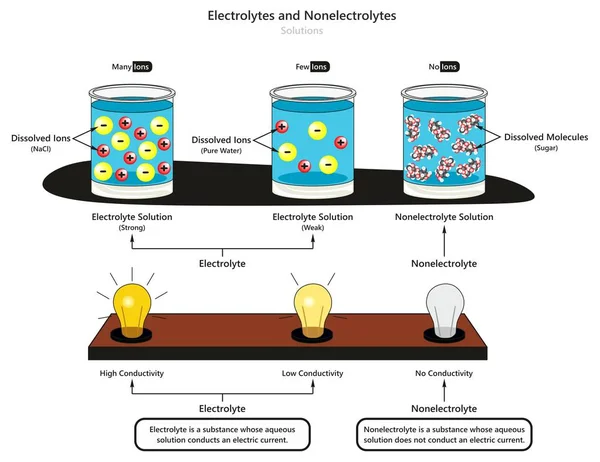
Electrolyte and Nonelectrolyte Solutions infographic diagram showing type of electrolytes weak and strong also comparison of conductivity and dissolved substances for chemistry science education
Electrolyte Nonelectrolyte Solutions Infographic Diagram Showing Type Electrolytes Weak Strong — Stock Vector
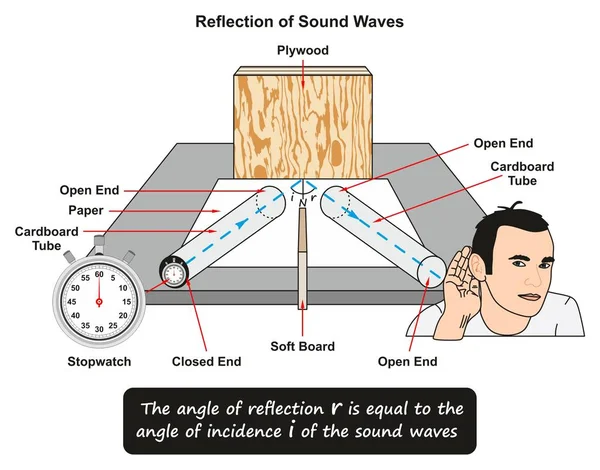
Reflection of Sound Waves showing a lab experiment where a stopwatch placed inside cardboard tube and waves reflected on plywood and man hearing sound from other cardboard tube for science education
Reflection Sound Waves Showing Lab Experiment Stopwatch Placed Cardboard Tube — Stock Vector
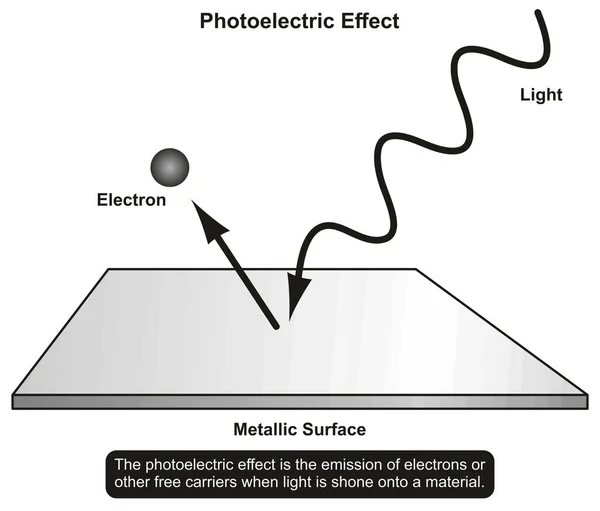
Photoelectric Effect infographic diagram showing light shone in to a material and emission of electron result for physics science education and matter properties
Photoelectric Effect Infographic Diagram Showing Light Shone Material Emission Electron — Stock Vector
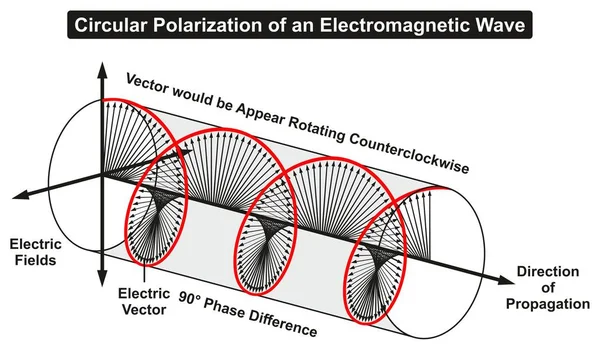
Circular Polarization of an Electromagnetic Light Wave infographic diagram showing electric fields phase difference direction of propagation rotating counterclockwise for physics science education
Circular Polarization Electromagnetic Light Wave Infographic Diagram Showing Electric Fields — Stock Vector
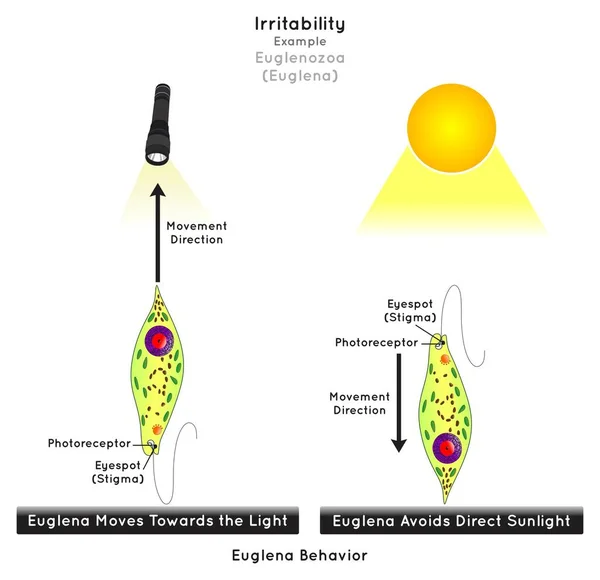
Irritability in Euglenozoa Infographic Diagram example euglena move toward light but it avoid direct sunlight stimulus receptor impulse response unicellular organism biology science education vector
Irritability Euglenozoa Infographic Diagram Example Euglena Move Light Avoid Direct — Stock Vector
Matter infographic diagram showing how it occupies space and has mass with examples of football sun air and water for physics science education
Matter Infographic Diagram Showing How Occupies Space Has Mass Examples — Stock Vector
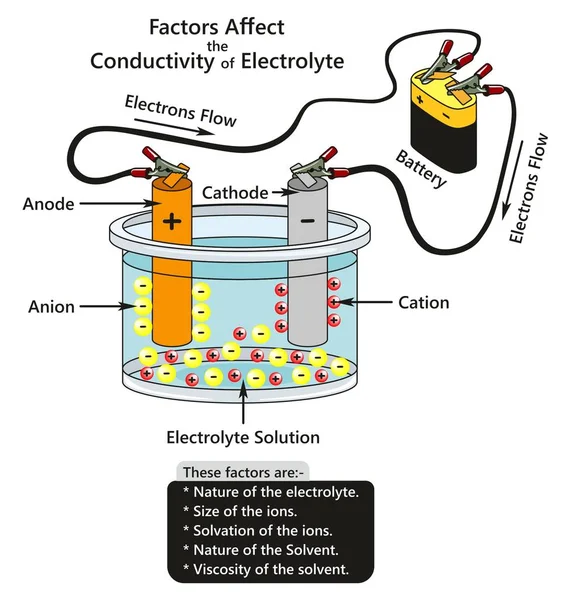
Factors Affect the Conductivity of Electrolyte infographic diagram showing a battery connected to cathode and anode in container contains electrolyte solution ions interaction for chemistry science
Factors Affect Conductivity Electrolyte Infographic Diagram Showing Battery Connected Cathode — Stock Vector
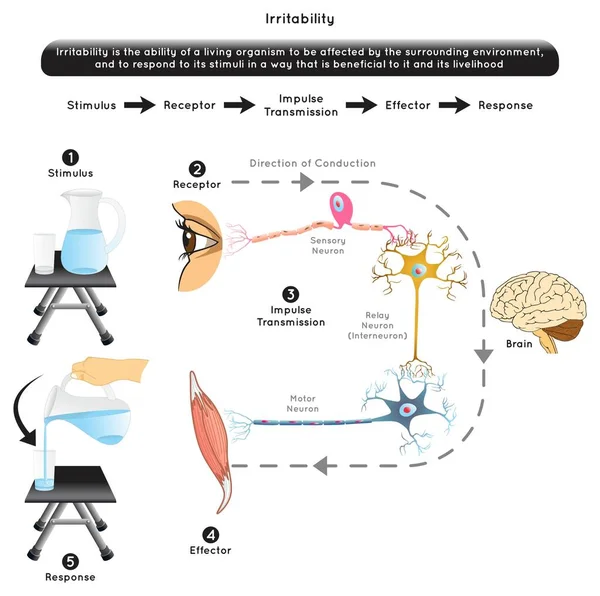
Irritability in Biology Infographic Diagram element stimulus receptor impulse effector response example human eye see water jug empty glass hand holding jug filling biological science education vector
Irritability Biology Infographic Diagram Element Stimulus Receptor Impulse Effector Response — Stock Vector
Light Reflection infographic diagram with example of light source where incoming rays reflected on a smooth shiny mirror surface for physics science education
Light Reflection Infographic Diagram Example Light Source Incoming Rays Reflected — Stock Vector
The Reflection Law Infographic Diagram with an example from a flat mirror showing incident and reflected rays direction and angles with reflecting plane of normal surface for physics science education
Reflection Law Infographic Diagram Example Flat Mirror Showing Incident Reflected — Stock Vector
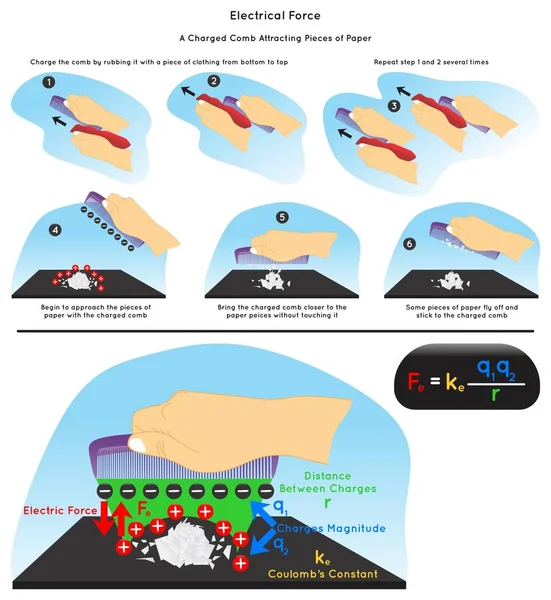
Electrical Force Infographic Diagram example rubbing comb with clothing producing static electricity attracting paper formula electric force distance charge magnitude physics science education vector
Electrical Force Infographic Diagram Example Rubbing Comb Clothing Producing Static — Stock Vector
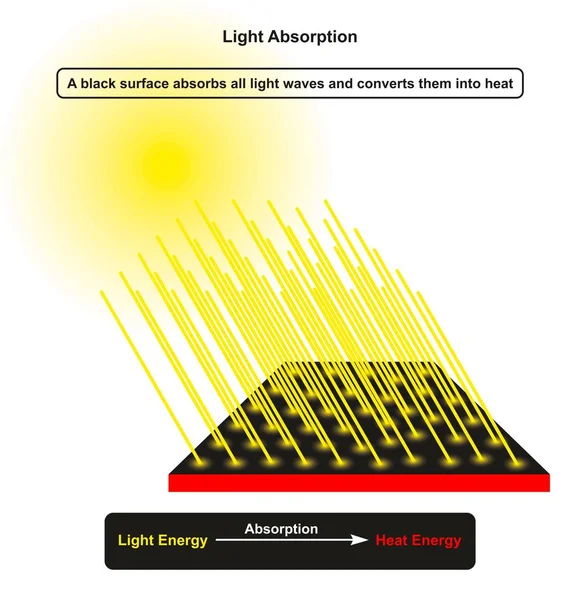
Light Absorption infographic diagram showing sun as a light source and incoming light rays hitting dark object surface which absorb it and convert it to heat energy for physics science education
Light Absorption Infographic Diagram Showing Sun Light Source Incoming Light — Stock Vector
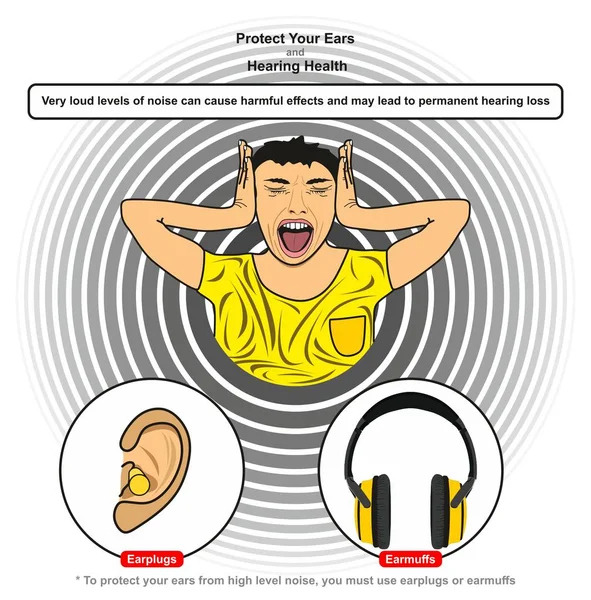
Protect you Ears and Hearing Health infographic diagram showing how high levels of noise can be harmful and cause hearing loss and protection using earplugs and earmuffs for physics science education
Protect You Ears Hearing Health Infographic Diagram Showing How High — Stock Vector
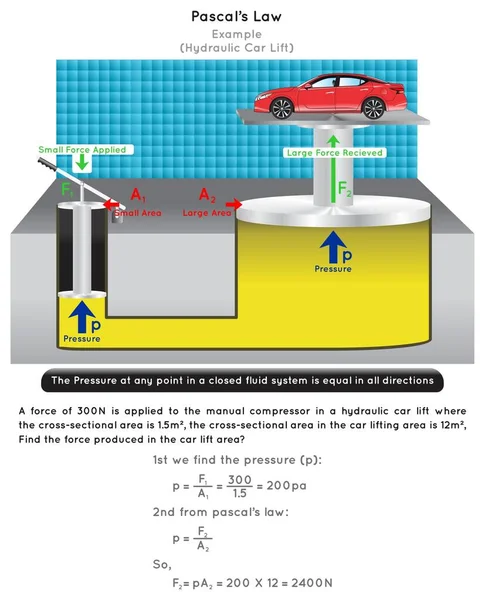
Pascal Law Infographic Diagram example of hydraulic car lift showing fluid pressure stay equal in closed system relation unit area force mathematical question answer physics science education vector
Pascal Law Infographic Diagram Example Hydraulic Car Lift Showing Fluid — Stock Vector

Usage Information

You can use this royalty-free vector image "Electromagnetic Spectrum Sources infographic diagram with radiations of gamma ray xray ultraviolet infrared radio waves wavelength frequency examples for communication science education" for personal and commercial purposes according to the Standard or Extended License. The Standard License covers most use cases, including advertising, UI designs, and product packaging, and allows up to 500,000 print copies. The Extended License permits all use cases under the Standard License with unlimited print rights and allows you to use the downloaded vector files for merchandise, product resale, or free distribution.

This stock vector image is scalable to any size. You can buy and download it in high resolution up to 2637x1578. Upload Date: Aug 22, 2018