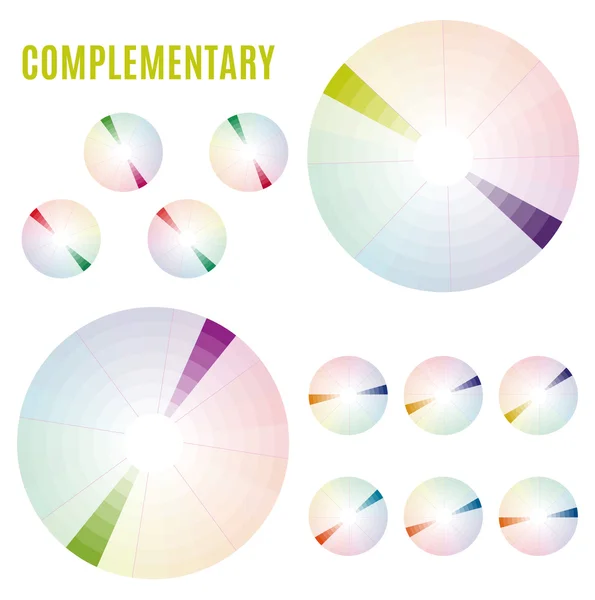
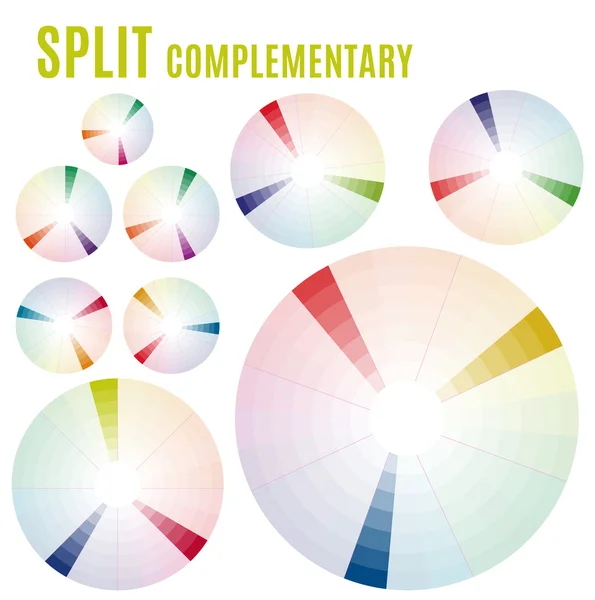
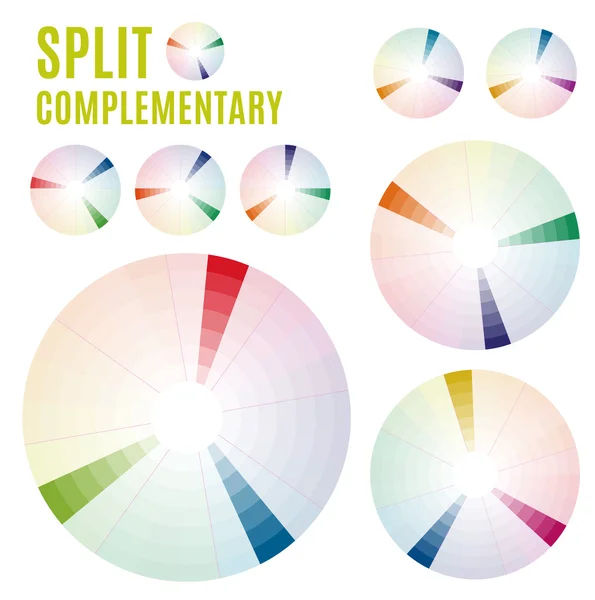
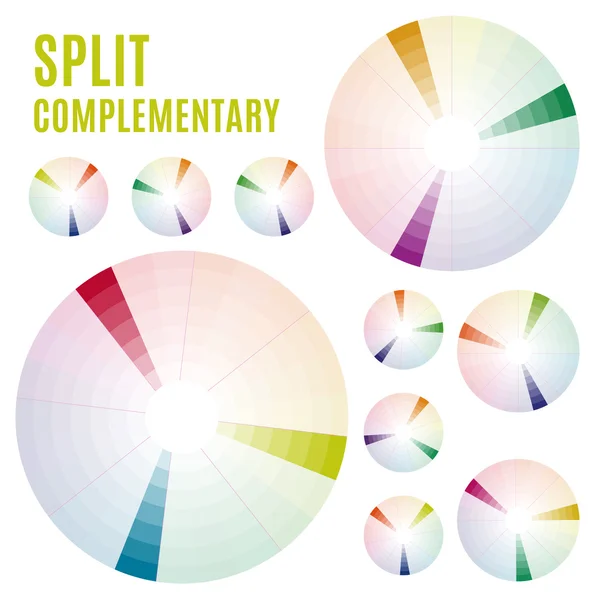
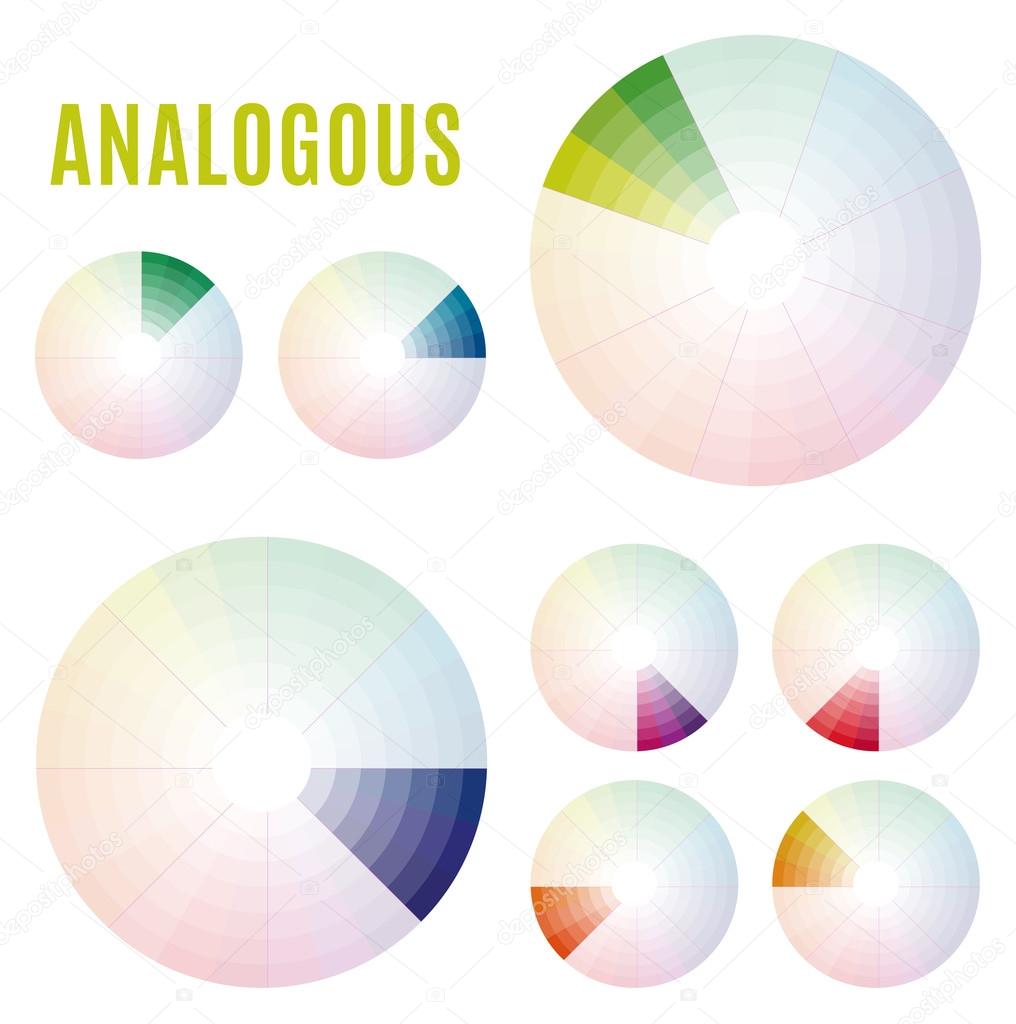
The Psychology of Colors Diagram - Wheel - Basic Colors Meaning. Analogous set — Stock Vector

The Psychology of Colors Diagram - Wheel - Basic Colors Meaning. Analogous set — Vector

Psychology of color perception. Harmonies of colors. Basic Analogous set. Representation in pie charts with the applicable pallets.

 — Vector by design_lounge

Similar Stock Videos:

Pie charts animation. percent circle round infographic. Grow or success profit diagram concept. Available in 4K FullHD and HD video
Pie charts animation. percent circle round infographic — Stock Video
Animation speedometer, tachometer, indicator icons with arrow. Performance measurement. Rating Meter. 4K video motion graphic animation
Animation speedometer, tachometer, indicator icons with arrow. Performance measurement. Rating Meter. 4K video motion graphic — Stock Video
Color wheel with shades icon animation cartoon best object isolated on white background
Color wheel with shades icon animation — Stock Video
Round indoor stadium icon animation cartoon best object isolated on white background
Round indoor stadium icon animation — Stock Video
Circle of grey and black colors moving isolated on white
Circle Grey Black Colors Moving Isolated White — Stock Video
Infographic triangle that appears with arrows, colorful hd scenes
Infographic triangle HD animation — Stock Video
Enter to win advertising text banner intro outro
Enter to win intro outro — Stock Video
Scale with arrow. Enhance profit level measuring device icon. Sign tachometer, speedometer, indicators. Infographic gauge element.
Measuring device concept — Stock Video
Pie charts animation. percent circle round infographic. Grow or success profit diagram concept. Available in 4K FullHD and HD video
Pie charts animation. percent circle round infographic — Stock Video
Growing 3D pie chart.(included alpha)
Indicate about 10 percents, growing 3D pie chart.(included alpha) — Stock Video
Colorful toy ball green screen animation for vfx
Colorful Toy Ball Green Screen Animation Vfx — Stock Video
Set of Beautiful Abstract Animations of Growing Charts and Stock Data. Financial Figures and Diagrams Showing Increasing Profits. White Version. 4k UHD 3840x2160.
Set of Beautiful Abstract Animations of Growing Charts and Stock Data. Financial Figures and Diagrams Showing Increasing Profits. White Version. 4k UHD 3840x2160. — Stock Video
Modern countdown with ColorBars and Calibrating symbols.
Modern countdown with ColorBars and Calibrating symbols. — Stock Video
Mix of different television and video glitches and static captured from old tvs
Mix Different Television Video Glitches Static Captured Old Tvs — Stock Video
Black line Financial growth icon isolated on white background. Increasing revenue. 4K Video motion graphic animation.
Black line Financial growth icon isolated on white background. Increasing revenue. 4K Video motion graphic animation — Stock Video
Circle diagram flow chart,(included alpha)
Circle diagram flow chart, seven circle.(included alpha) — Stock Video
Small sports stadium icon animation cartoon best object isolated on white background
Small sports stadium icon animation — Stock Video
Circle diagramresult category chart for presentation.version 2 powerpoint template
Circle diagram three result category chart for presentation.version 2 powerpoint template(included alpha) — Stock Video

Usage Information

You can use this royalty-free vector image "The Psychology of Colors Diagram - Wheel - Basic Colors Meaning. Analogous set" for personal and commercial purposes according to the Standard or Extended License. The Standard License covers most use cases, including advertising, UI designs, and product packaging, and allows up to 500,000 print copies. The Extended License permits all use cases under the Standard License with unlimited print rights and allows you to use the downloaded vector files for merchandise, product resale, or free distribution.

This stock vector image is scalable to any size. You can buy and download it in high resolution up to 5000x5039. Upload Date: Jan 3, 2016