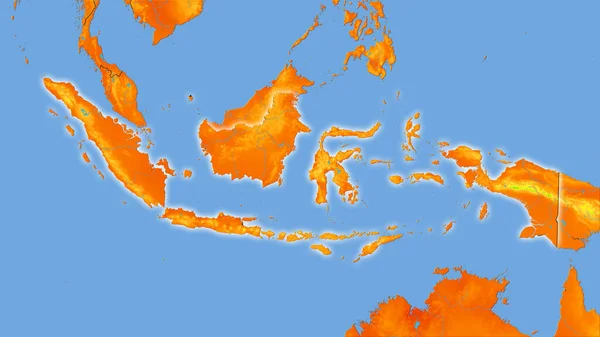
Indonesia Area Annual Temperature Map Stereographic Projection Main Composition — Stock Photo, Image

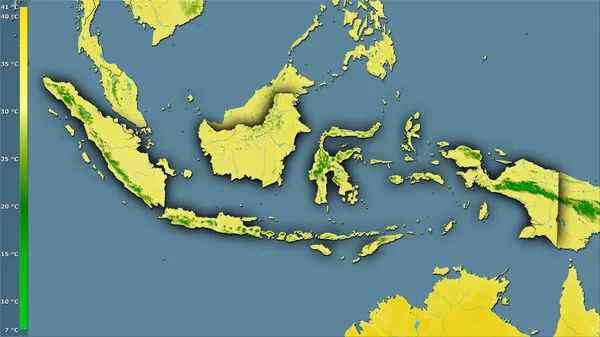
Indonesia area on the annual temperature map in the stereographic projection - main composition — Photo

Indonesia area on the annual temperature map in the stereographic projection - main composition

 — Photo by Yarr65

Same Series:

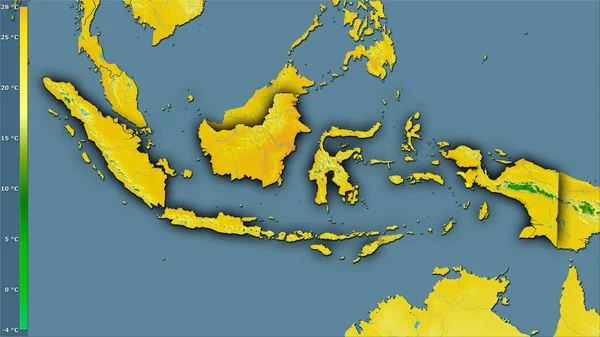
Maximum temperature of warmest month within the Indonesia area in the stereographic projection with legend - main composition
Maximum Temperature Warmest Month Indonesia Area Stereographic Projection Legend Main — Stock Photo, Image
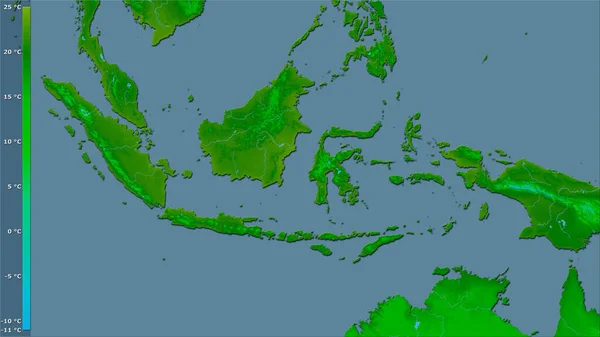
Minimum temperature of coldest month within the Indonesia area in the stereographic projection with legend - raw composition of raster layers with light glowing outline
Minimum Temperature Coldest Month Indonesia Area Stereographic Projection Legend Raw — Stock Photo, Image
Indonesia area on the annual temperature map in the stereographic projection - raw composition of raster layers with light glowing outline
Indonesia Area Annual Temperature Map Stereographic Projection Raw Composition Raster — Stock Photo, Image
Minimum temperature of coldest month within the Indonesia area in the stereographic projection with legend - raw composition of raster layers with dark glowing outline
Minimum Temperature Coldest Month Indonesia Area Stereographic Projection Legend Raw — Stock Photo, Image
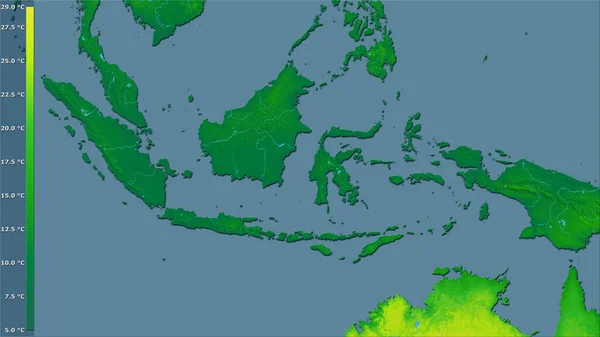
Mean annual temperature variation within the Indonesia area in the stereographic projection with legend - raw composition of raster layers with dark glowing outline
Mean Annual Temperature Variation Indonesia Area Stereographic Projection Legend Raw — Stock Photo, Image
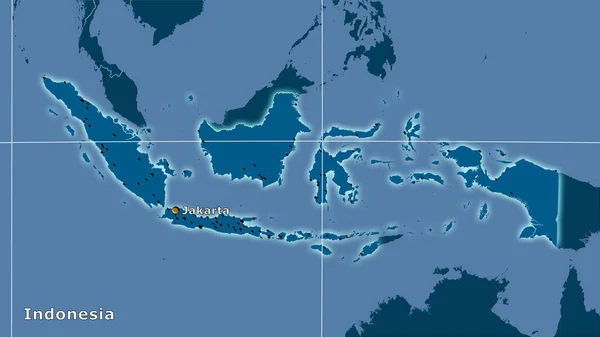
Indonesia area on the solid map in the stereographic projection - main composition
Indonesia Area Solid Map Stereographic Projection Main Composition — Stock Photo, Image
Indonesia area on the annual temperature map in the stereographic projection - raw composition of raster layers with dark glowing outline
Indonesia Area Annual Temperature Map Stereographic Projection Raw Composition Raster — Stock Photo, Image
Mean temperature of coldest quarter within the Indonesia area in the stereographic projection with legend - raw composition of raster layers with dark glowing outline
Mean Temperature Coldest Quarter Indonesia Area Stereographic Projection Legend Raw — Stock Photo, Image
Minimum temperature of coldest month within the Indonesia area in the stereographic projection with legend - raw composition of raster layers
Minimum Temperature Coldest Month Indonesia Area Stereographic Projection Legend Raw — Stock Photo, Image
Mean temperature of warmest quarter within the Indonesia area in the stereographic projection with legend - raw composition of raster layers with dark glowing outline
Mean Temperature Warmest Quarter Indonesia Area Stereographic Projection Legend Raw — Stock Photo, Image
Maximum temperature of warmest month within the Indonesia area in the stereographic projection with legend - raw composition of raster layers with dark glowing outline
Maximum Temperature Warmest Month Indonesia Area Stereographic Projection Legend Raw — Stock Photo, Image
Mean temperature of warmest quarter within the Indonesia area in the stereographic projection with legend - raw composition of raster layers with light glowing outline
Mean Temperature Warmest Quarter Indonesia Area Stereographic Projection Legend Raw — Stock Photo, Image
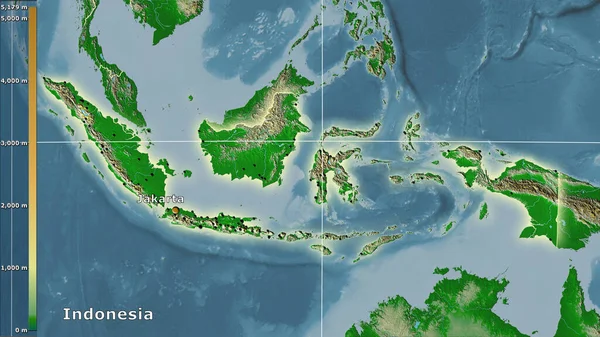
Physical map within the Indonesia area in the stereographic projection with legend - main composition
Physical Map Indonesia Area Stereographic Projection Legend Main Composition — Stock Photo, Image
Mean annual temperature variation within the Indonesia area in the stereographic projection with legend - raw composition of raster layers
Mean Annual Temperature Variation Indonesia Area Stereographic Projection Legend Raw — Stock Photo, Image
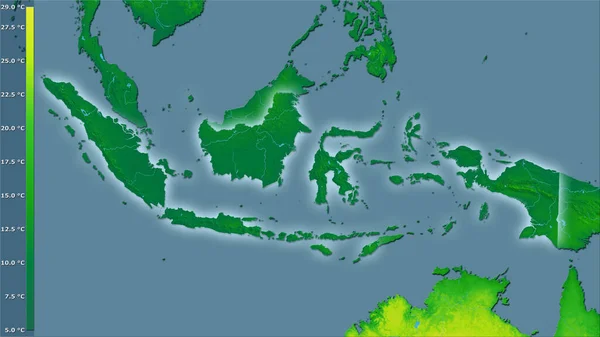
Mean annual temperature variation within the Indonesia area in the stereographic projection with legend - raw composition of raster layers with light glowing outline
Mean Annual Temperature Variation Indonesia Area Stereographic Projection Legend Raw — Stock Photo, Image
Indonesia area on the satellite B map in the stereographic projection - main composition
Indonesia Area Satellite Map Stereographic Projection Main Composition — Stock Photo, Image

Usage Information

You can use this royalty-free photo "Indonesia area on the annual temperature map in the stereographic projection - main composition" for personal and commercial purposes according to the Standard or Extended License. The Standard License covers most use cases, including advertising, UI designs, and product packaging, and allows up to 500,000 print copies. The Extended License permits all use cases under the Standard License with unlimited print rights and allows you to use the downloaded stock images for merchandise, product resale, or free distribution.

You can buy this stock photo and download it in high resolution up to 2880x1620. Upload Date: Jun 20, 2020