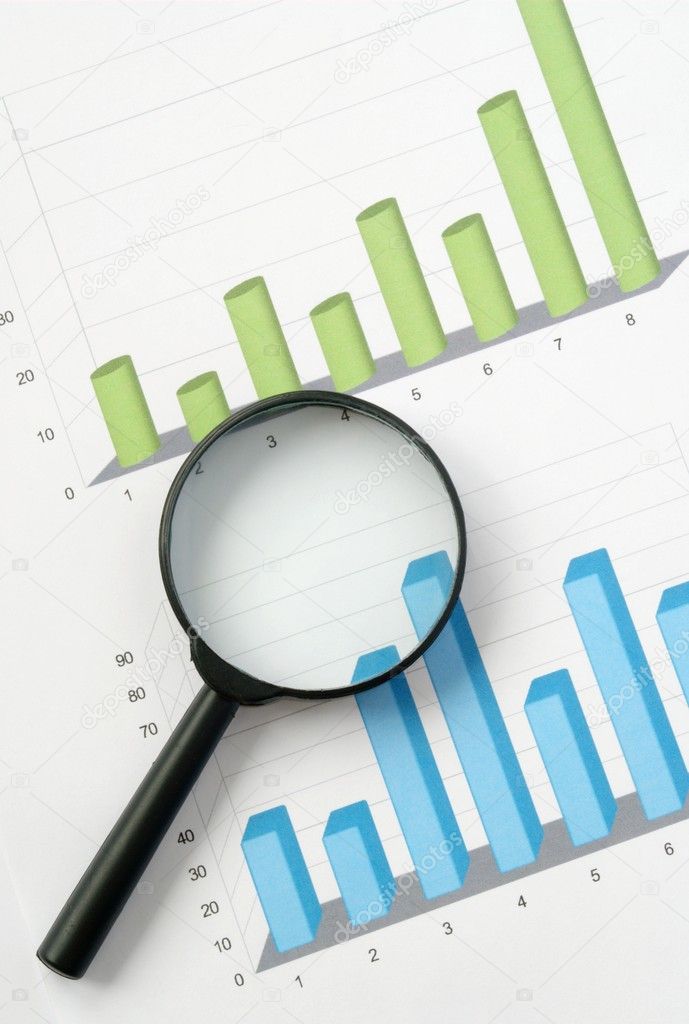
Two graphs on a sheet of paper — Stock Photo, Image

Two graphs on a sheet of paper — Photo

Green and blue chart and office objects

 — Photo by serggn

Same Series:

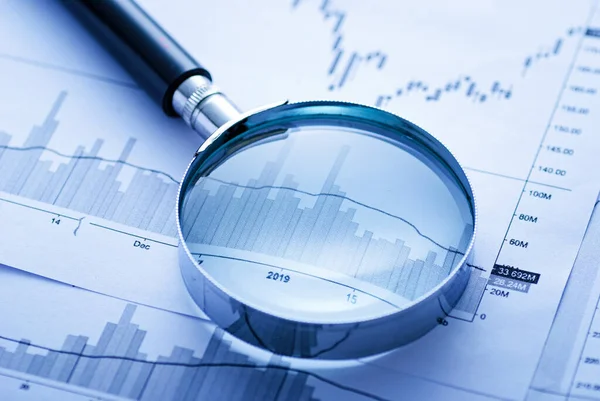
Magnifying glass on the table and the schedule and place for your text
Magnifying glass on the table and the schedule and place for your text — Stock Photo, Image
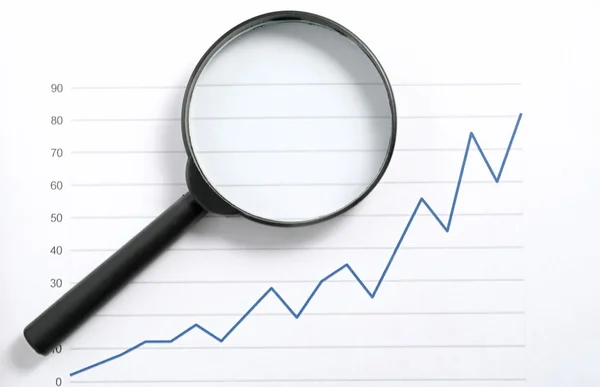
Loop and the schedule of the green line shows the growth of
Chart and a magnifying glass — Stock Photo, Image
Magnifying glass and pen on business charts showing a fluctuating performance and increasing profit in a concept of accounting, research or an audit
Magnifying Glass Pen Business Charts Showing Fluctuating Performance Increasing Profit — Stock Photo, Image
Small round metal magnifying glass with a bar graph conceptual of analysis, investigation and research
Magnifying glass with a bar graph — Stock Photo, Image
Loop and the schedule of the green line shows the growth of
Chart and a magnifying glass — Stock Photo, Image
Loop and the schedule of the green line shows the growth of
Chart and a magnifying glass — Stock Photo, Image
Magnifying glass and pen on business charts showing a fluctuating performance and increasing profit in a concept of accounting, research or an audit
Magnifying Glass Pen Business Charts Showing Fluctuating Performance Increasing Profit — Stock Photo, Image
Document showing a bar graph, pie graphs and a fluctuating chart depicting business performance, planning, projections and strategy
Business performance — Stock Photo, Image
Loop and the schedule on a sheet of paper
Office items — Stock Photo, Image
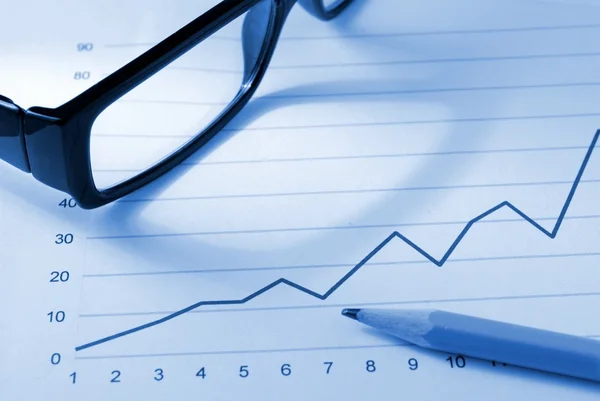
Schedule, glasses and pen on the desk
Office items — Stock Photo, Image
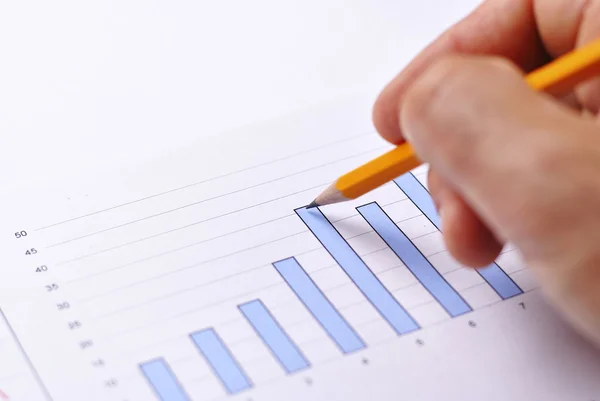
Close up view of a male hand holding a pencil analysing a fluctuating bar graph showing business performance
Analysing a bar graph — Stock Photo, Image
Close up view of a male hand holding a pencil analysing a fluctuating bar graph showing business performance
Analysing a bar graph — Stock Photo, Image
Open office journal on a decreasing bar graph or chart with pen labelled income in a concept of failure, losses or poor performance in a close up view
Open Office Journal Decreasing Bar Graph Chart Pen Labelled Income — Stock Photo, Image
Conceptual image of a navigational magnetic compass on a fluctuating business graph with copyspace above
Magnetic compass on a graph — Stock Photo, Image
Close up view of a male hand holding a pencil analysing a fluctuating bar graph showing business performance
Analysing a bar graph — Stock Photo, Image
Close up view of a male hand holding a pencil analysing a fluctuating bar graph showing business performance
Analysing a bar graph — Stock Photo, Image

Usage Information

You can use this royalty-free photo "Two graphs on a sheet of paper" for personal and commercial purposes according to the Standard or Extended License. The Standard License covers most use cases, including advertising, UI designs, and product packaging, and allows up to 500,000 print copies. The Extended License permits all use cases under the Standard License with unlimited print rights and allows you to use the downloaded stock images for merchandise, product resale, or free distribution.

You can buy this stock photo and download it in high resolution up to 2356x3500. Upload Date: Jan 28, 2012