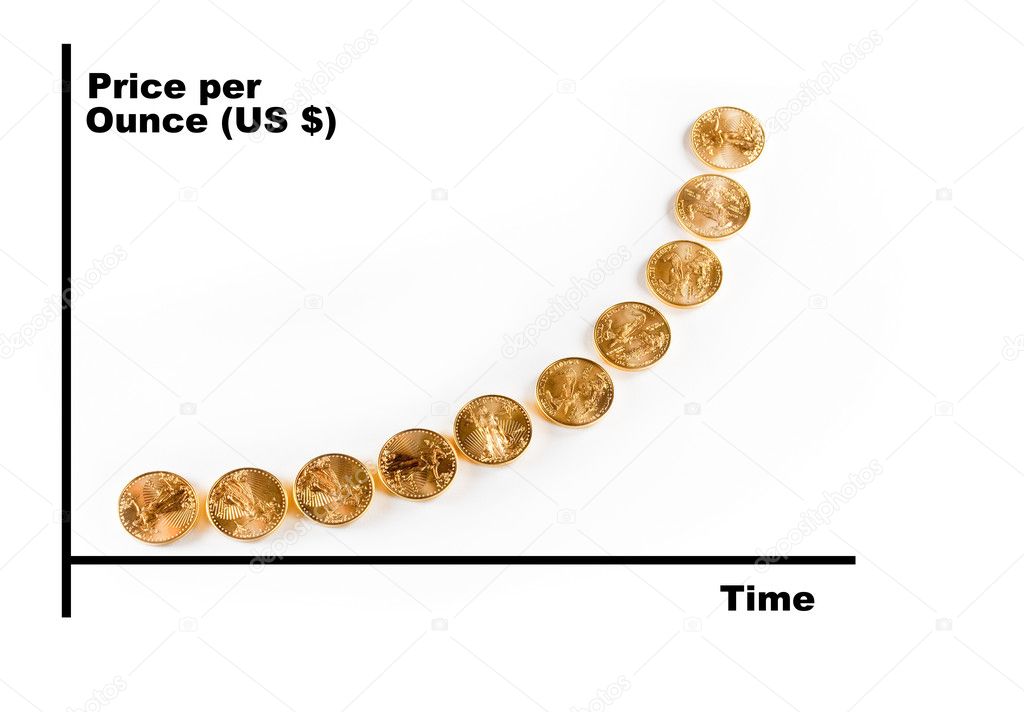
Graph of gold price over time — Stock Photo, Image

Graph of gold price over time — Photo

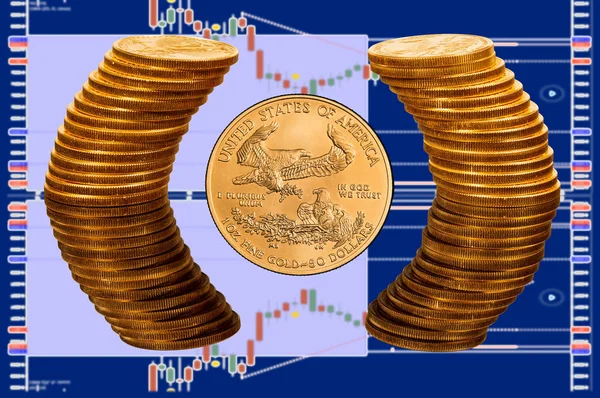
Professional graph of the price of gold over time using golden eagle coins as the graph

 — Photo by steveheap

Same Series:

Many gold coins arranged as a graph to illustrate the rise in price of pure gold as an investment
Gold coins on a black background illustrating the rise in the price of gold — Stock Photo, Image
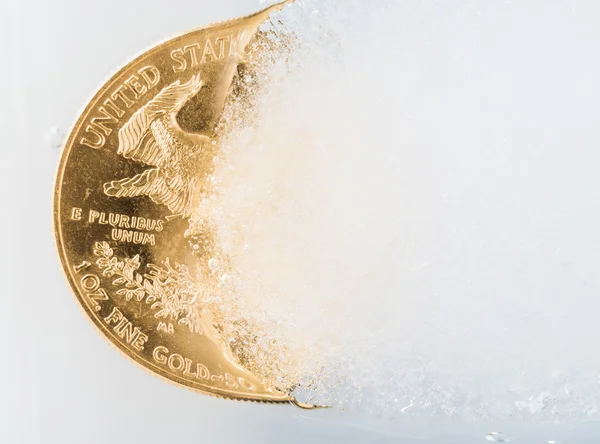
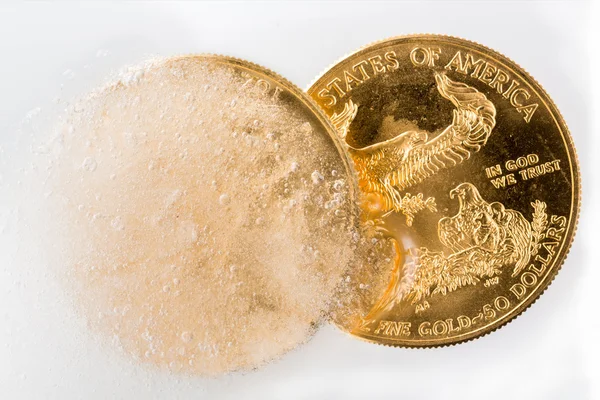
Gold eagle one ounce coin emerging from a frozen ice block to illustrate concept of gold coming out of deep freeze, pricing going to rise
Golden Eagle coin emerging from deep freeze — Stock Photo, Image
Single Litecoin coin on stack of silver coins with graph of price change against US dollar in background
Litecoin coin against background of price graph — Stock Photo, Image
Single gold eagle coin with pure gold coins reflected in glass surface. Gives illusion of being surrounded by ring of gold with background of trading screen
Gold Eagle coin surrounded by ring of gold — Stock Photo, Image
Hands of three financial traders gripping gold eagle coin against a background of rising prices for the currency
Three traders hands holding large gold coin — Stock Photo, Image
Gold Eagle one ounce coin against a golden background of other coins with focus on the Liberty symbol
Liberty Gold Eagle one ounce coin — Stock Photo, Image
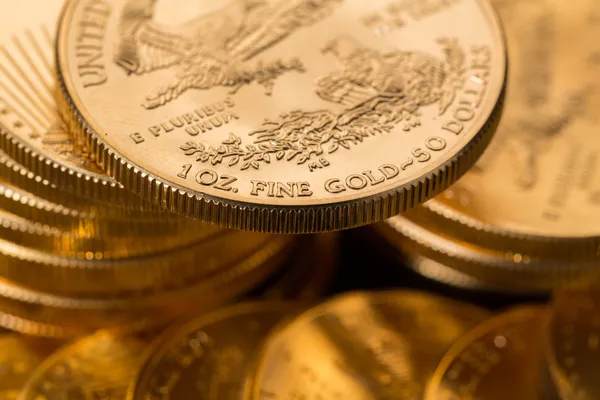
Close up of a solid gold eagle one ounce coin stacked on other coins and reflected in black surface
Macro image of gold eagle coin on stack — Stock Photo, Image
Gold eagle one ounce coin emerging from a frozen ice block to illustrate concept of gold coming out of deep freeze and price going to rise
Golden Eagle coin emerging from deep freeze — Stock Photo, Image
Focus on a stack of gold coins with other coin stacked in the background out of focus
Gold coins stacked with other piles in the background out of focus — Stock Photo, Image
Focus on a stack of gold coins with other coin stacked in the background out of focus
Gold coins stacked with other piles in the background out of focus — Stock Photo, Image
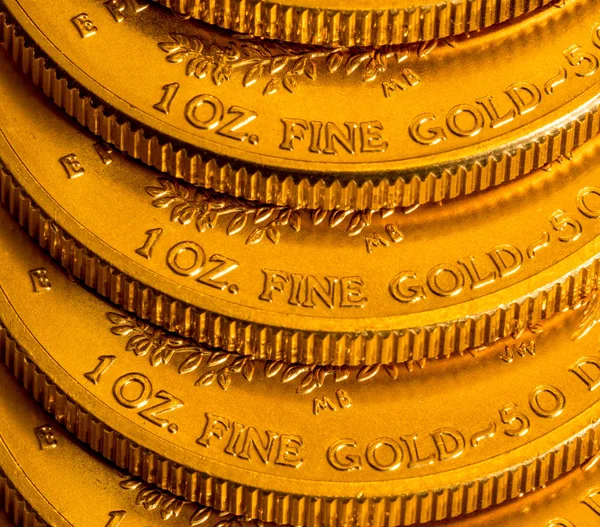
Stacks of gold eagle one troy ounce golden coins from US Treasury mint
Collection of one ounce gold coins — Stock Photo, Image
Stack of golden coins using US Treasury issue Gold Eagle one ounce pure gold coin
Stack of US Treasury Gold Eagle one ounce coins — Stock Photo, Image
Stacks of gold eagle one troy ounce golden coins from US Treasury mint
Collection of one ounce gold coins — Stock Photo, Image
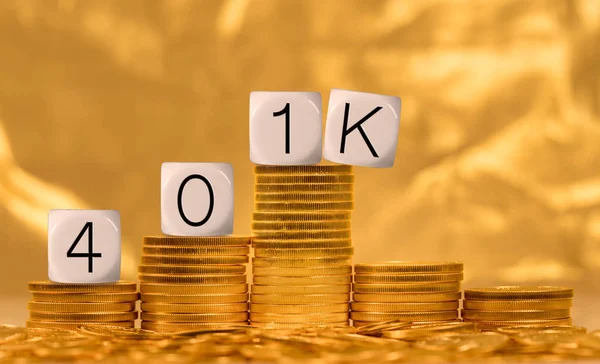
Concept of growth in retirement savings accounts but risk of market crash losing value
Concept for market crash affecting 401K plans — Stock Photo, Image
Stacks of gold eagle one troy ounce golden coins from US Treasury mint
Collection of one ounce gold coins — Stock Photo, Image
Stacks of gold eagle one troy ounce golden coins from US Treasury mint
Collection of one ounce gold coins — Stock Photo, Image

Usage Information

You can use this royalty-free photo "Graph of gold price over time" for personal and commercial purposes according to the Standard or Extended License. The Standard License covers most use cases, including advertising, UI designs, and product packaging, and allows up to 500,000 print copies. The Extended License permits all use cases under the Standard License with unlimited print rights and allows you to use the downloaded stock images for merchandise, product resale, or free distribution.

You can buy this stock photo and download it in high resolution up to 5816x4044. Upload Date: Nov 28, 2009