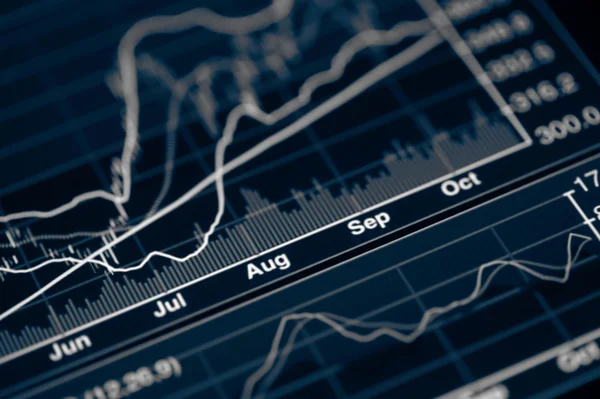
Financial diagram — Stock Photo, Image

Financial diagram — Photo

Financial graphic chart

 — Photo by micrologia

Same Series:

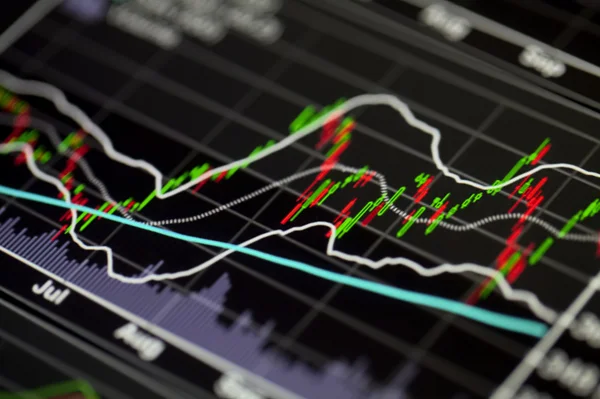
Close-up photograph of stock market chart
Stock market chart — Stock Photo, Image
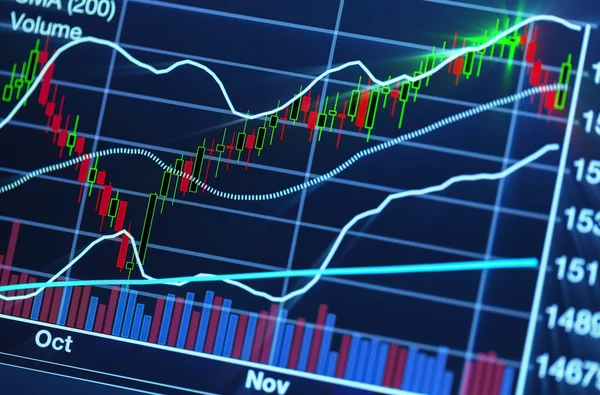
Close up photograph of stock market char
Stock market chart — Stock Photo, Image
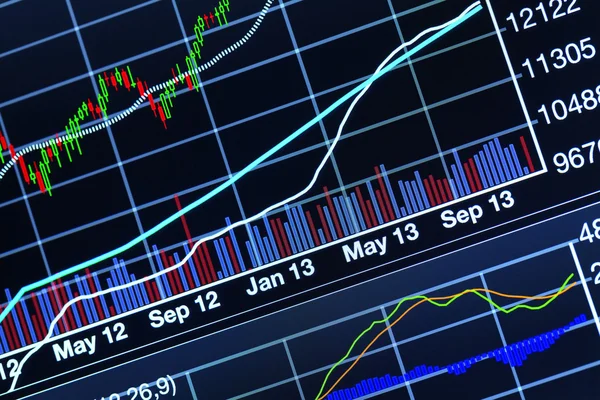
Close up photograph of stock market chart
Stock market chart — Stock Photo, Image
Close up photograph of technical analysis chart
Technical analysis chart — Stock Photo, Image
Close up photograph of stock market char
Stock market chart — Stock Photo, Image
Close-up photograph of stock market chart
Stock market chart — Stock Photo, Image
Concept of thinking businessman: Businesman figurine with hands behind back and deciding to make a decision while standing in front of stock market chart on the background.
Concept Thinking Businessman Businesman Figurine Hands Back Deciding Make Decision — Stock Photo, Image
Business agreement concept: Two businessman figurine shaking hands in front of blurry stock market chart. Partnership, success, investment, dealing concept.
Business Agreement Concept Two Businessman Figurine Shaking Hands Front Blurry — Stock Photo, Image
Businessman making a gesture with his hands behind stock market chart. Stock exchange and balance in economy concept.
Businessman Making Gesture His Hands Stock Market Chart Stock Exchange — Stock Photo, Image
A businessman in a suit holds hands in a timeout on dark background. Glowing red arrow going downwards. Recession, inflation, economic crisis.
Businessman Suit Holds Hands Timeout Dark Background Glowing Red Arrow — Stock Photo, Image
Economist forecast for the United States. Glowing green arrow going upwards on 100 dollar bill. The appreciation and rise of the US dollar. Price increases per dollar. Closeup detail of dollar bill.
Economist Forecast United States Glowing Green Arrow Going Upwards 100 — Stock Photo, Image
Businessman figurine pondering next to Turkish Lira banknote rolls and red arrow going downwards. Devaluation, downturn, inflation and economy concept. Focus on businessman.
Businessman Figurine Pondering Next Turkish Lira Banknote Rolls Red Arrow — Stock Photo, Image
Hand holding compass with bitcoin, libra, ethereum and ripple logo in front of stock market chart data. compass needle showing libra symbol.
Cryptocurrency concept — Stock Photo, Image
Concept of thinking businessman: Businesman figurine with hand on cheek deciding to make a decision while looking at the stock market chart on the background.
Concept Thinking Businessman Businesman Figurine Hand Cheek Deciding Make Decision — Stock Photo, Image
Male hand holding compass with dogecoin in front of stock market chart data. Compass needle showing buy word. Cryptocurrency trading concept.
Male Hand Holding Compass Dogecoin Front Stock Market Chart Data — Stock Photo, Image
Black cubes with BUY, SELL and HODL text on white background. Thinking businessman figurine with question marks above his head looking at cubes while leaning to bitcoin stack. Cryptocurrency, blockchain or trading concept.
Black Cubes Buy Sell Hodl Text White Background Thinking Businessman — Stock Photo, Image

Usage Information

You can use this royalty-free photo "Financial diagram" for personal and commercial purposes according to the Standard or Extended License. The Standard License covers most use cases, including advertising, UI designs, and product packaging, and allows up to 500,000 print copies. The Extended License permits all use cases under the Standard License with unlimited print rights and allows you to use the downloaded stock images for merchandise, product resale, or free distribution.

You can buy this stock photo and download it in high resolution up to 5616x3744. Upload Date: Jul 6, 2013