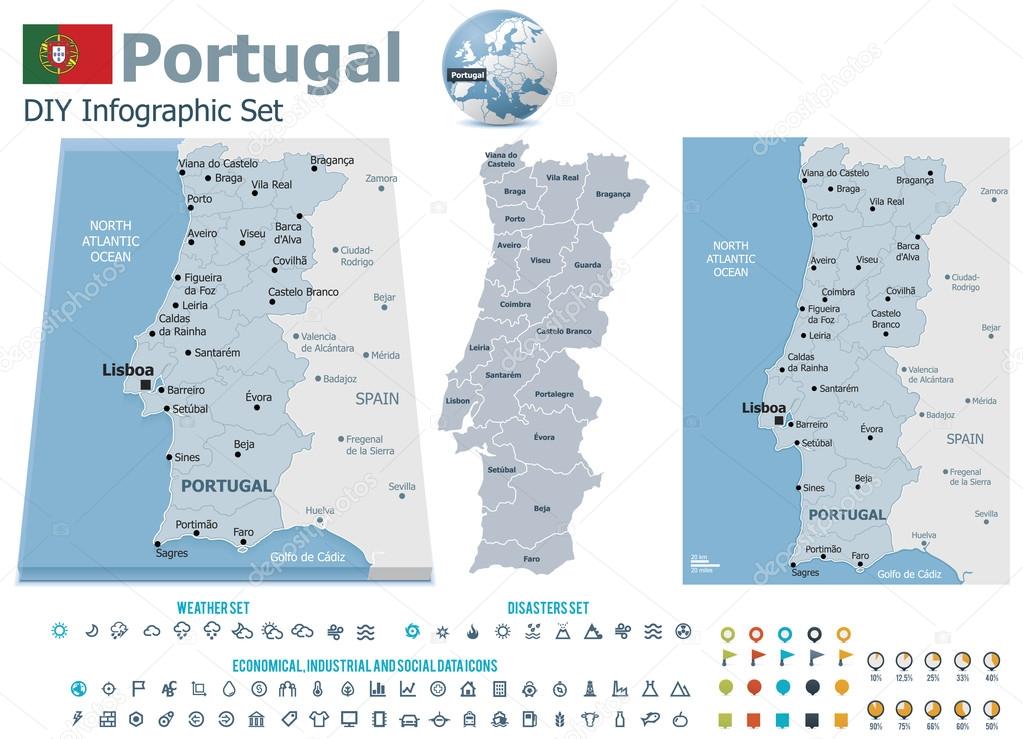
Portugal maps with markers — Stock Vector

Portugal maps with markers — Vector

Set of the political Portugal maps, markers and symbols for infographic

 — Vector by tele52

Similar Stock Videos:
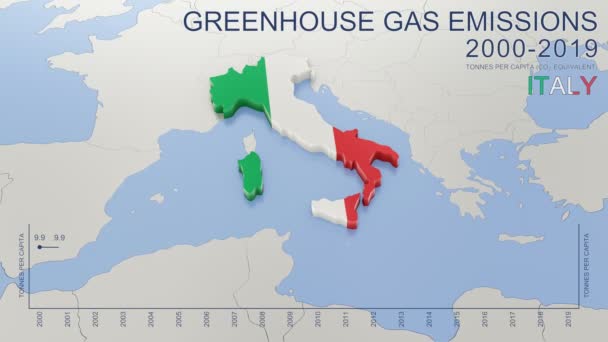
Greenhouse gas emissions in Italy from 2000 to 2019. Values in tonnes per capita (CO2 equivalent). Source data: Eurostat. 3D rendering loop able video with 4K resolution.
Greenhouse Gas Emissions Italy 2000 2019 Values Tonnes Capita Co2 — Stock Video
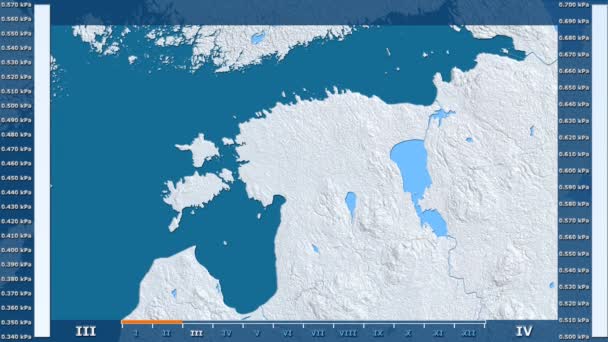
Water vapor pressure by month in the Estonia area with animated legend - raw color shader. Stereographic projection
Water Vapor Pressure Month Estonia Area Animated Legend Raw Color — Stock Video
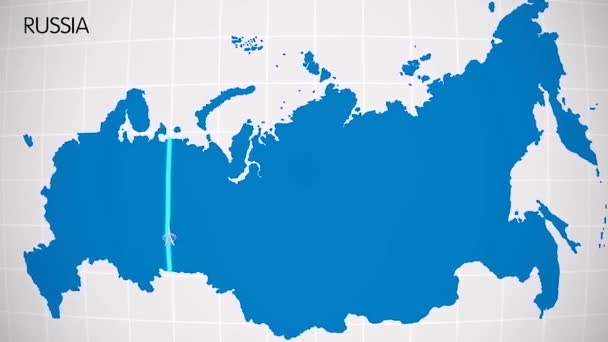
The division of Europe and Asia on the map. the city Ekaterinburg divides Europe and Asia. Eurasia on the map Animation. Eurasia. Yekaterinburg animation HD
The division of Europe and Asia on the map. the city Ekaterinburg divides Europe and Asia. Eurasia on the map Animation. Eurasia. Yekaterinburg animation — Stock Video
Greenhouse gas emissions in France from 2000 to 2019. Values in tonnes per capita (CO2 equivalent). Source data: Eurostat. 3D rendering loop able video with 4K resolution.
Greenhouse Gas Emissions France 2000 2019 Values Tonnes Capita Co2 — Stock Video
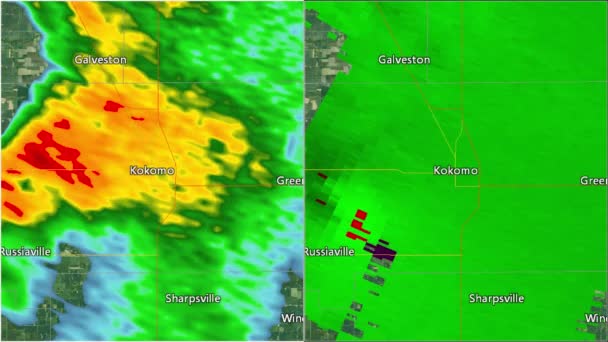
2016 Kokomo, IN tornado. Depicts radar imagery (reflectivity) on the left, and base velocity (wind speed and direction) on the right. Taken by National Weather Service NEXRAD radar.
2016 Kokomo, IN Tornado Doppler Radar Split-screen — Stock Video
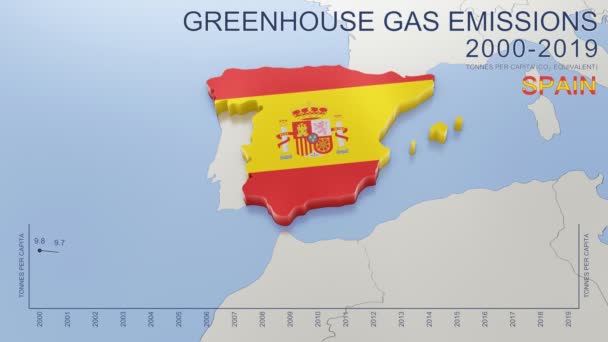
Greenhouse gas emissions in Spain from 2000 to 2019. Values in tonnes per capita (CO2 equivalent). Source data: Eurostat. 3D rendering loop able video with 4K resolution.
Greenhouse Gas Emissions Spain 2000 2019 Values Tonnes Capita Co2 — Stock Video
Greenhouse gas emissions in Denmark from 2000 to 2019. Values in tonnes per capita (CO2 equivalent). Source data: Eurostat. 3D rendering loop able video with 4K resolution.
Greenhouse Gas Emissions Denmark 2000 2019 Values Tonnes Capita Co2 — Stock Video
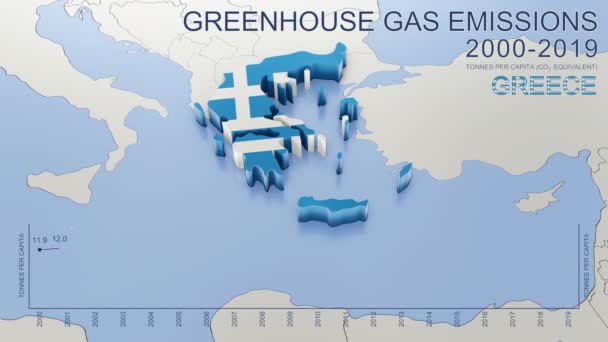
Greenhouse gas emissions in Greece from 2000 to 2019. Values in tonnes per capita (CO2 equivalent). Source data: Eurostat. 3D rendering loop able video with 4K resolution.
Greenhouse Gas Emissions Greece 2000 2019 Values Tonnes Capita Co2 — Stock Video
Thank You Word Cloud in vector format.(multi language translation: Thank you)
Thank You Word Cloud Vector Format Multi Language Translation Thank — Stock Video
The plane takes off and land at the airport in the night and day. There are views from the windows and interior. Check out the runway, accelerate and take off into the night. View the wing against the sky.
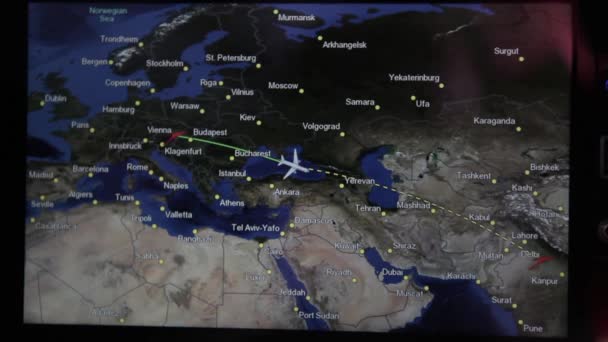
The plane takes off at the airport. Exterior and interior. People and flight attendant on the plane are going. The TV screen shows parameters of the flight. — Stock Video
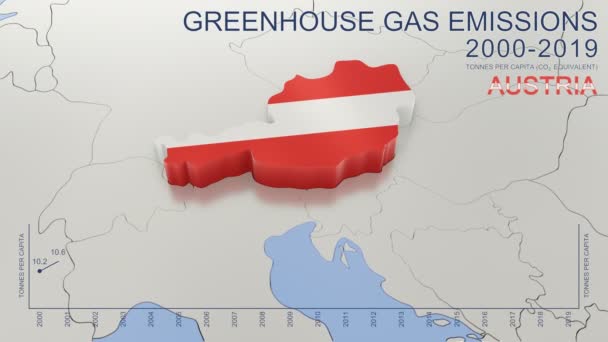
Greenhouse gas emissions in Austria from 2000 to 2019. Values in tonnes per capita (CO2 equivalent). Source data: Eurostat. 3D rendering loop able video with 4K resolution.
Greenhouse Gas Emissions Austria 2000 2019 Values Tonnes Capita Co2 — Stock Video
World map, Island travel. Beach Tour, Flying airplane, illustration animation, vacation.
World map, Island travel. Beach Tour, Flying airplane, illustration animation, vacation. — Stock Video
Pins Appearing In A Map Of Australia Showing The Largest Cities In Population Order
Pins Appearing Map Australia Showing Largest Cities Population Order — Stock Video
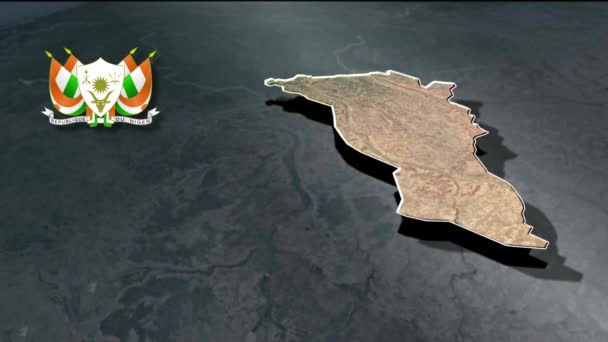
Regions of Niger geographic map
Regions Niger Geographic Map — Stock Video
Globe hand draw on white background
Globe hand draw — Stock Video
Watercolor animated map showing the state of Minnesota from the united state of American. 2d map of Minnesota. 4k Motion graphics.
Watercolor animated map showing the state of Minnesota from the united state of American. 2d map of Minnesota. — Stock Video
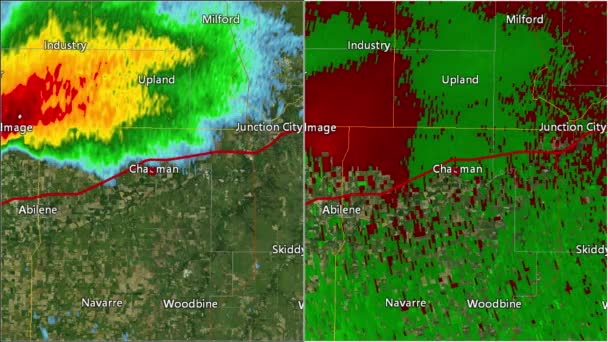
2016 Solomon/Abilene/Chapman, Kansas tornado. Depicts radar imagery (reflectivity) on the left, and base velocity (wind speed and direction) on the right. Taken by National Weather Service NEXRAD radar.
2016 Solomon/Abilene/Chapman, KS Tornado Doppler Radar (Split Screen) — Stock Video
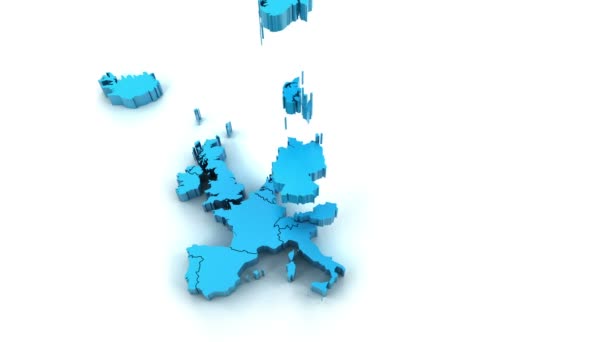
3d animation of Europe map formed by individual countries
3d animation of Europe map formed by individual countries — Stock Video

Usage Information

You can use this royalty-free vector image "Portugal maps with markers" for personal and commercial purposes according to the Standard or Extended License. The Standard License covers most use cases, including advertising, UI designs, and product packaging, and allows up to 500,000 print copies. The Extended License permits all use cases under the Standard License with unlimited print rights and allows you to use the downloaded vector files for merchandise, product resale, or free distribution.

This stock vector image is scalable to any size. You can buy and download it in high resolution up to 5765x4163. Upload Date: Sep 14, 2013