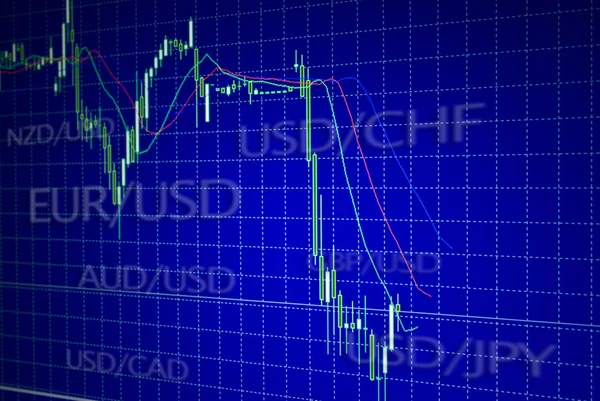
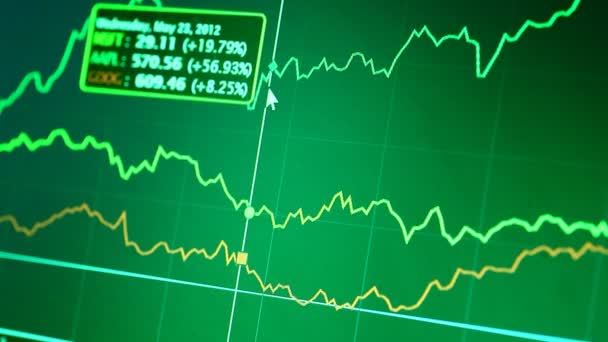
Forex stock market candle graph analysis on the screen — Stock Photo, Image

Forex stock market candle graph analysis on the screen — Photo

Forex stock market candle graph analysis on the screen

 — Photo by Mattz90

Similar Stock Videos:

Stock markets down dynamic chart on dynamic blue background. Concept of financial stagnation, recession, crisis, business crash and economic collapse. Downward trend 3d animation.
Stock Markets Dynamic Chart Dynamic Blue Background Concept Financial Stagnation — Stock Video
Global business decline, crisis and stock markets down with dynamic chart on blue background. Concept of financial stagnation, recession, crash and economic collapse. Downward trend 3d animation.
Global Business Decline Crisis Stock Markets Dynamic Chart Blue Background — Stock Video
Stock markets down dynamic chart on dynamic red background. Concept of financial stagnation, recession, crisis, business crash and economic collapse. Downward trend 3d animation.
Stock Markets Dynamic Chart Dynamic Red Background Concept Financial Stagnation — Stock Video
Recession, business crash, markets down, economic collapse and stock crisis concept. Red dynamic downward trend chart. 3d seamless and loopable animation.
Recession Business Crash Markets Economic Collapse Stock Crisis Concept Red — Stock Video
Growth up stock markets green chart 3d loop animation. Success, rising business and financial graph, economy data diagram and money investment analysis loopable and seamless abstract concept.
Growth Stock Markets Green Chart Loop Animation Success Rising Business — Stock Video
3D rendering. Infographic of particles. Two-color chart. Interface element. HUD. Interference of waves is unpredictable. Looped footage video clip.4K.
Rendering Infographic Particles Two Color Chart Interface Element Hud Interference — Stock Video
Medical Scan Screen
Medical Scan Screen — Stock Video
Market diagram
Market diagram — Stock Video
Increase in the number of cases up chart. Abstract loopable and seamless background animation. Concept graph of global danger growth, virus pandemic, coronavirus infection alert or covid-19 epidemic.
Increase Number Cases Chart Abstract Loopable Seamless Background Animation Concept — Stock Video
Virus global cases increase, coronavirus, epidemic, infection warning, health, covid-19 and viral pandemic growth chart on world map seamless loopable 3d animation. Abstract concept background.
Virus Global Cases Increase Coronavirus Epidemic Infection Warning Health Covid — Stock Video
Recession text on stock markets down chart. Concept of crisis, financial stagnation, global business decline, crash and economic collapse. Downward trend 3d animation.
Recession Text Stock Markets Chart Concept Crisis Financial Stagnation Global — Stock Video
Internet web chart on LED display
Internet web chart on LED display — Stock Video
MRI scan on computer monitor
MRI scan — Stock Video
Animation of stock market display with green and blue stock market numbers and graphs, price going up and down at the stock exchange recording data in the background.
Animation Stock Market Display Green Blue Stock Market Numbers Graphs — Stock Video
Futuristic digital business forex market candle chart rise 3d animation of financial diagram grows on bullish market showing growth and increasing profit economics concept with alpha channel
Futuristic Digital Business Forex Market Candle Chart Rise Animation Financial — Stock Video
Digital animation of interface codes. The background has molecular structures and geometric shapes
Digital Animation Interface Codes Background Has Molecular Structures Geometric Shapes — Stock Video
Live Graph of Internet Trading of Currency. Live chart on the Internet exchange Bitcoin to dollar. Financial concept and background of Internet trading. Exchange online quotes. The flow of economic
Live Graph of Internet Trading of Currency — Stock Video
Kaleidoscope seamless loop sequence mandala patterns abstract multicolored motion graphics background. Ideal for yoga, clubs, shows
Kaleidoscope Seamless Loop Sequence Mandala Patterns Abstract Multicolored Motion Graphics — Stock Video

Usage Information

You can use this royalty-free photo "Forex stock market candle graph analysis on the screen" for personal and commercial purposes according to the Standard or Extended License. The Standard License covers most use cases, including advertising, UI designs, and product packaging, and allows up to 500,000 print copies. The Extended License permits all use cases under the Standard License with unlimited print rights and allows you to use the downloaded stock images for merchandise, product resale, or free distribution.

You can buy this stock photo and download it in high resolution up to 3872x2592. Upload Date: Jan 5, 2014