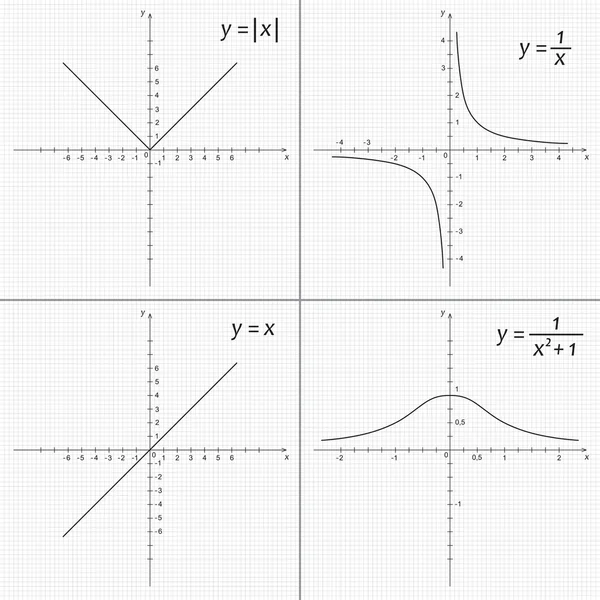
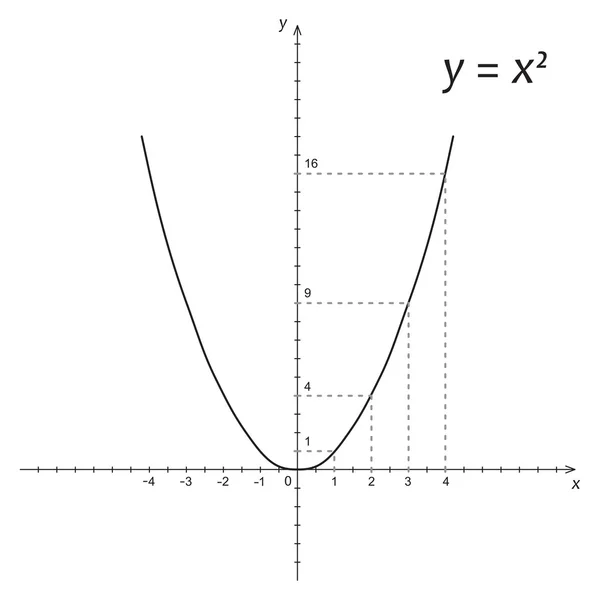
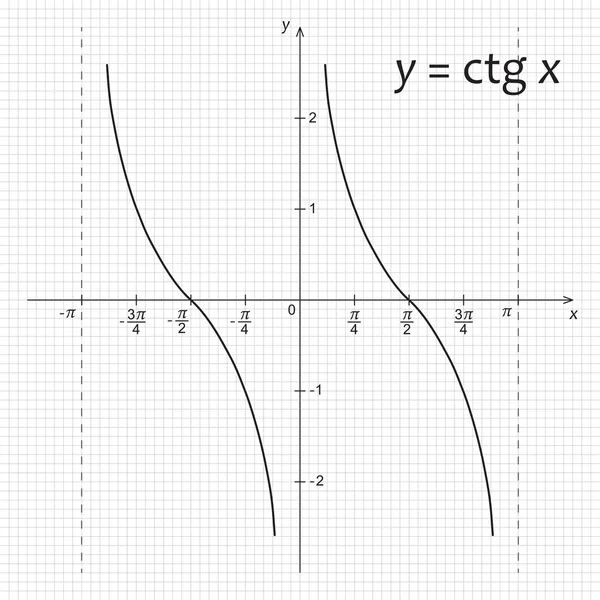
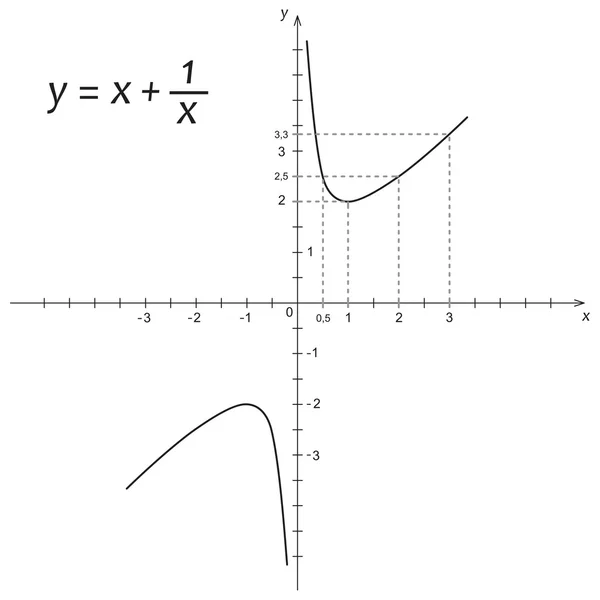
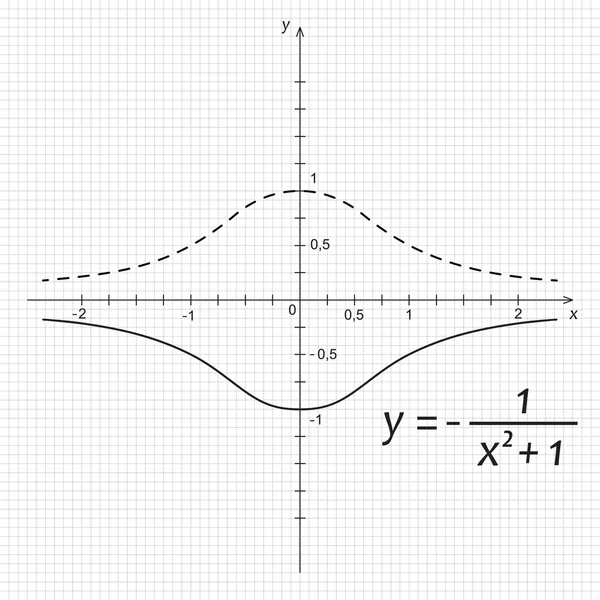
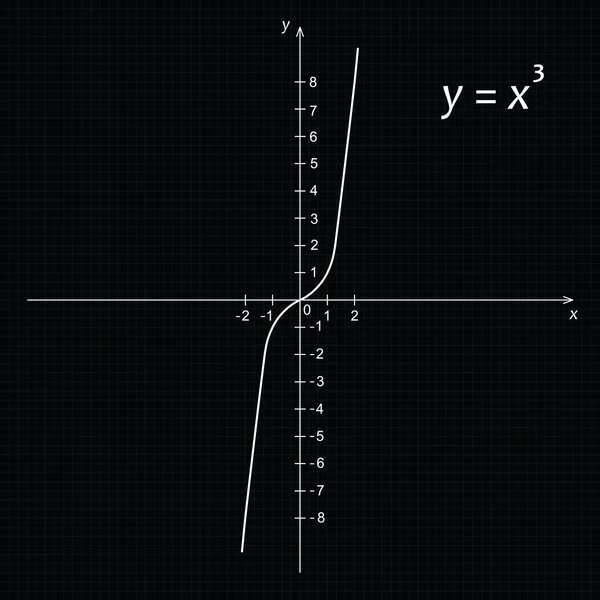
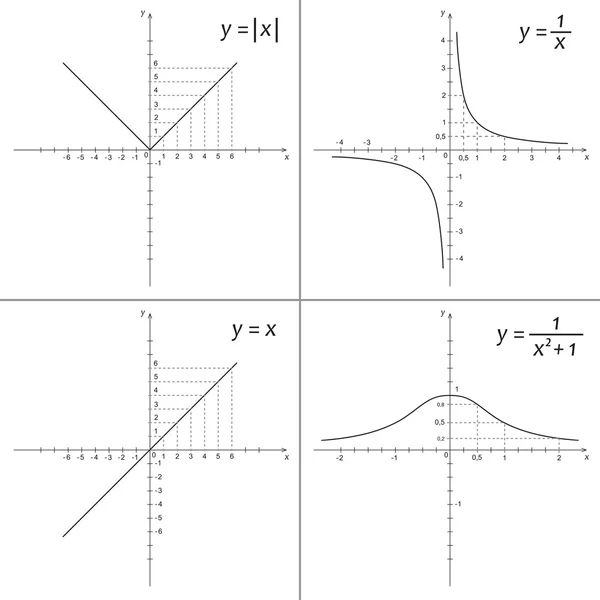
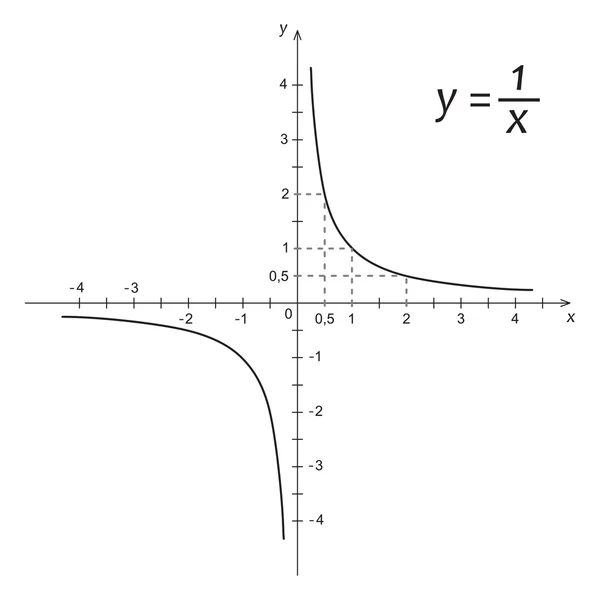
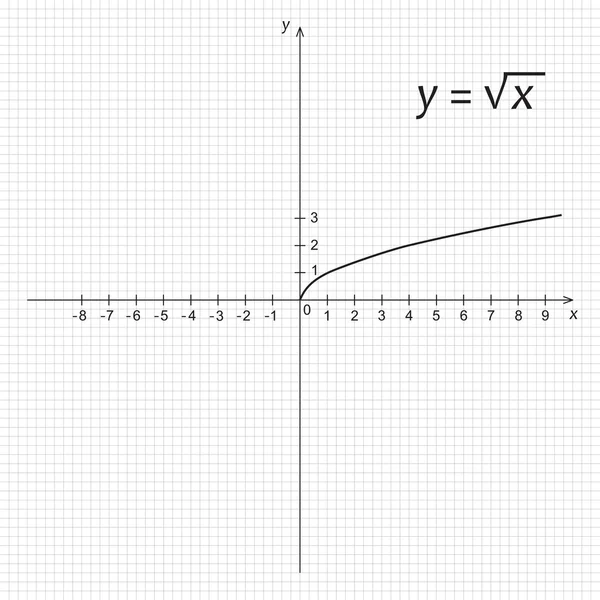
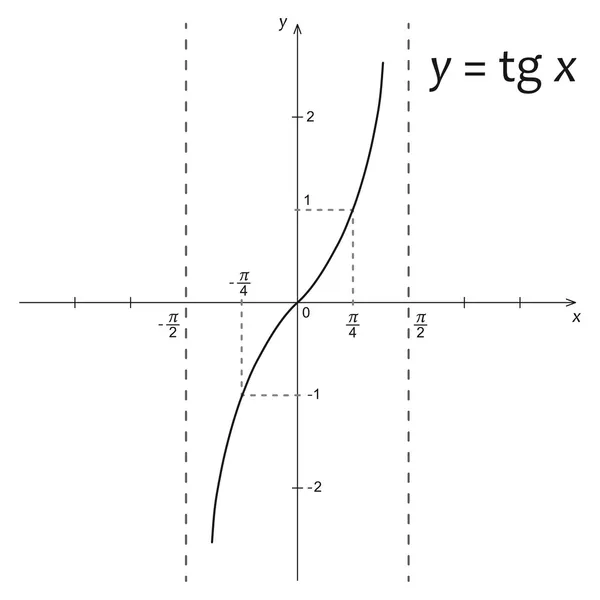
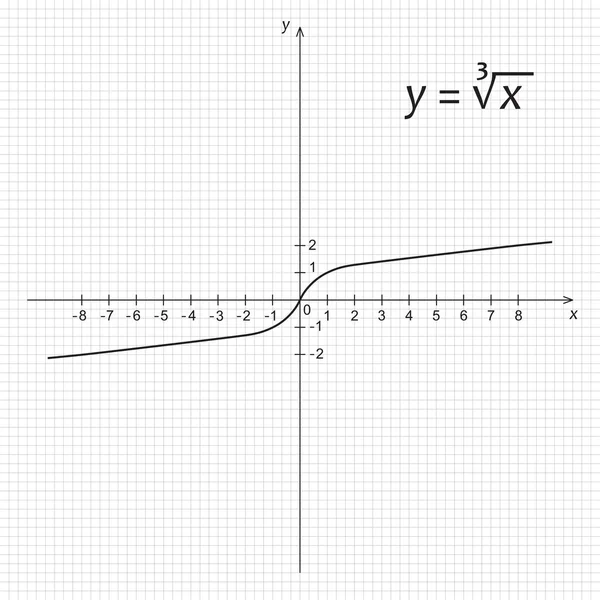
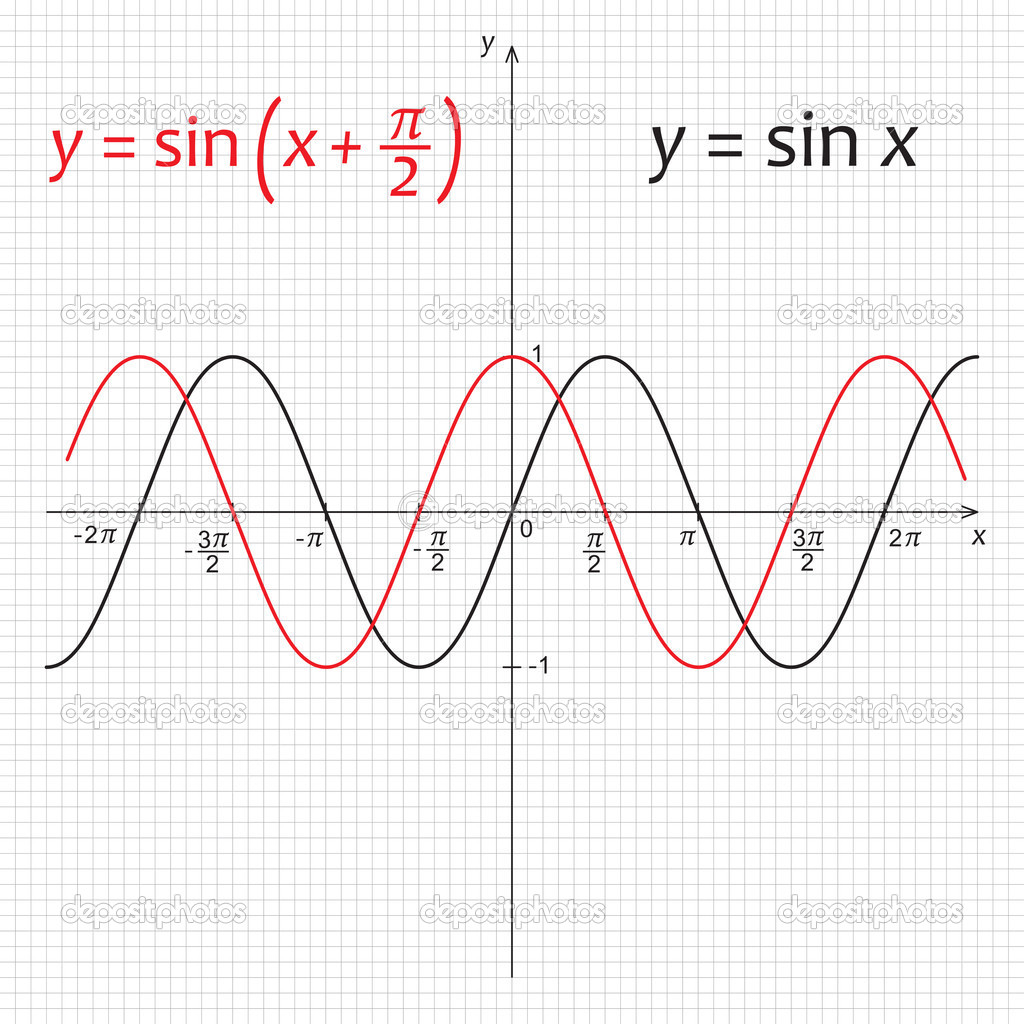
Diagram of trigonometric functions sinus — Stock Vector

Diagram of trigonometric functions sinus — Vector

Vector illustration of trigonometric functions sinus

 — Vector by julvil11

Similar Stock Videos:
Rendering Graph Paper With Wiggly Variation Sine Wave Investments Investing
Rendering Graph Paper With Wiggly Variation Sine Wave Investments Investing — Stock Video
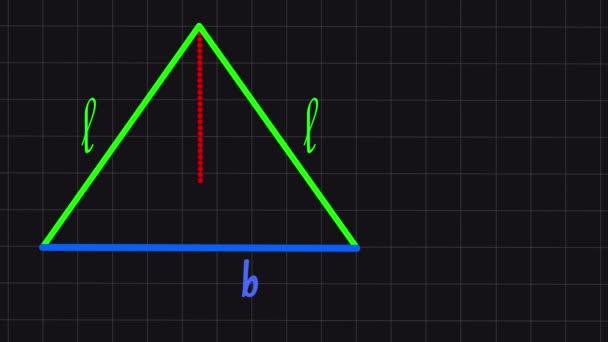
Basic geometry lesson the triangle
Basic Geometry Lesson Triangle — Stock Video
4K financial stock chart,Business digital Data trend hud Graph,Stock Market,Changing Economic node line.
4K financial stock chart,Business Data trend hud Graph,Economic node line. — Stock Video
Statistics concept made of male hand draw falling black graph become blue on pink checkered background
Statistics Concept Made Male Hand Draw Falling Black Graph Become — Stock Video
Stock index chart on a white background. Suitable for any stock market related purposes.
Stock index chart — Stock Video
Animation of financial data processing on green background. global technology, digital interface and networks concept digitally generated video.
Animation Financial Data Processing Green Background Global Technology Digital Interface — Stock Video
Stock index chart on a dark green background. Suitable for any stock market related purposes.
Stock index chart — Stock Video
Line charts drawn on paper. Handwritten stock charts, financial graphs and math formulas
Line Charts Drawn Paper Handwritten Stock Charts Financial Graphs Math — Stock Video
COVID-19, Coronavirus. Growing graph of infected people. Concept for medical publishing, news, social media. Light grid background with red words. SARS-CoV-2
Covid Coronavirus Growing Graph Infected People Concept Medical Publishing News — Stock Video
Animation of three red statistic lines over a grey grid with numbers and markers appearing on digital display. Global finances and statistics concept digitally generated image.
Animation Three Red Statistic Lines Grey Grid Numbers Markers Appearing — Stock Video
Line graph profit growth on a white background
Line graph profit growth — Stock Video
Animation of green line with statistics and data processing over grid. global business, digital interface and technology concept digitally generated video.
Animation Green Line Statistics Data Processing Grid Global Business Digital — Stock Video
Stock index chart on a white background. Suitable for any stock market related purposes.
Stock index chart — Stock Video
Line graph profit growth on a white background
Line graph profit growth — Stock Video
Animation of register text and data processing on black background. social media and communication interface concept digitally generated video.
Animation Register Text Data Processing Black Background Social Media Communication — Stock Video
Animation of a grey grid with numbers and red and green markers on white digital display. Global finances and statistics concept digitally generated image.
Animation Grey Grid Numbers Red Green Markers White Digital Display — Stock Video
Animation of red lines statistics processing over grid. global finances, business, digital interface and technology concept digitally generated video.
Animation Red Lines Statistics Processing Grid Global Finances Business Digital — Stock Video

Usage Information

You can use this royalty-free vector image "Diagram of trigonometric functions sinus" for personal and commercial purposes according to the Standard or Extended License. The Standard License covers most use cases, including advertising, UI designs, and product packaging, and allows up to 500,000 print copies. The Extended License permits all use cases under the Standard License with unlimited print rights and allows you to use the downloaded vector files for merchandise, product resale, or free distribution.

This stock vector image is scalable to any size. You can buy and download it in high resolution up to 5120x5120. Upload Date: Jun 27, 2014