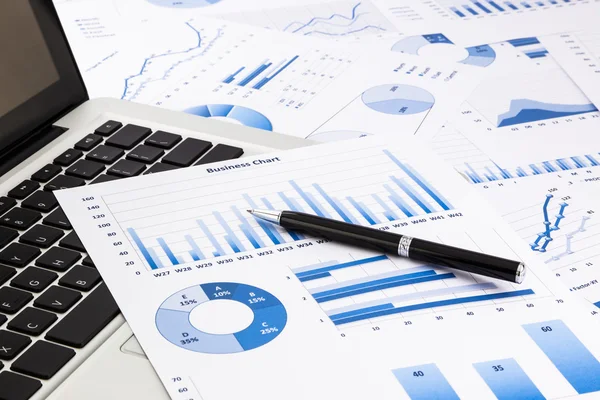
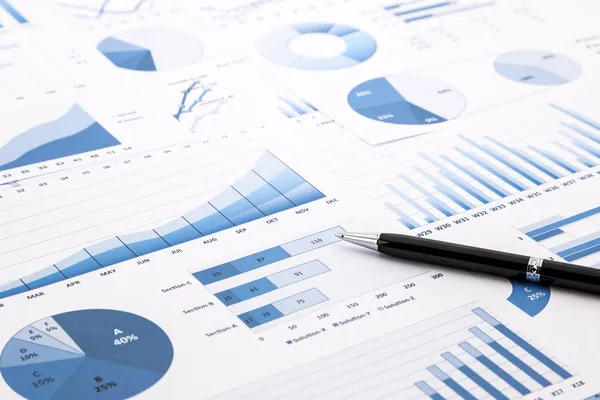
Blue business charts, graphs, information and reports — Stock Photo, Image

Blue business charts, graphs, information and reports — Photo

Calculator and pen with blue business charts, graphs, infomation and reports background for financial and business concepts

 — Photo by vinnstock

Same Series:

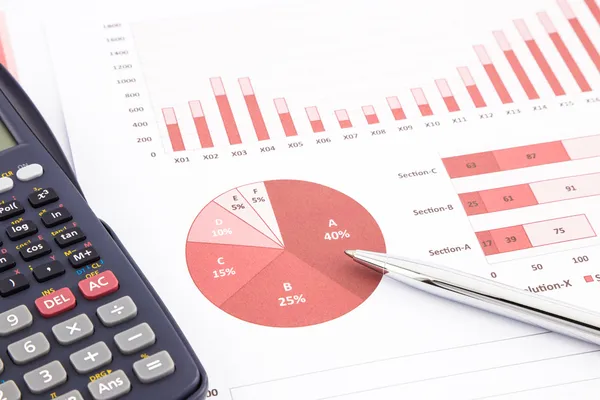
Calculator and pen with red business charts, graphs, reports and summarizing background, management and project for business concepts
Red business charts, graphs, report and summarizing background — Stock Photo, Image
Business concept and ideas, financial report, graphs and chats
Graphs and charts, financial report — Stock Photo, Image
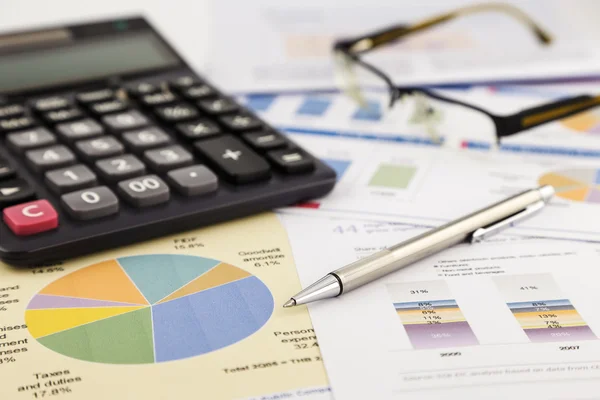
Yellow graphs, charts, data and business report summarizing background with 2015 number on calculator, management project and planning goals for new year's resolution
Graphs background with 2015 number on calculator — Stock Photo, Image
Business concept and ideas, financial report, graphs and chats
Analysis report, business concepts — Stock Photo, Image
Close up calculator on financial summary report
Accounting and finance — Stock Photo, Image
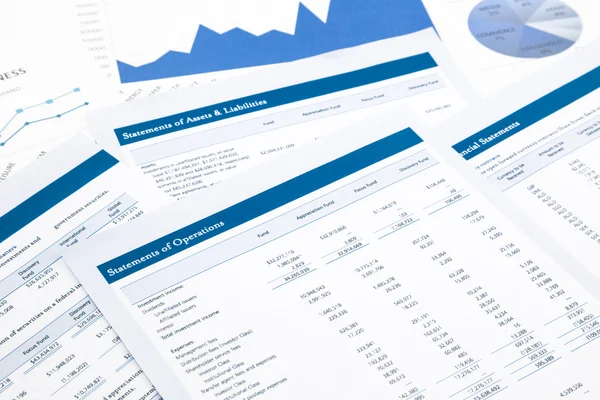
Statements of operations, business report and paperwork
Statements of operations — Stock Photo, Image
Closeup the silver modern pen on financial and accounting reports with increase coin stacks, glasses and calculator in background. Concepts of tax planning and budget management.
Budget and tax planning with raising coin stacks. — Stock Photo, Image
Financial statements, summary reports with modern pen and calculator. Concepts of accounting, audit evaluation, tax planning and business marketing.
Audit and accounting reports of financial statements. — Stock Photo, Image
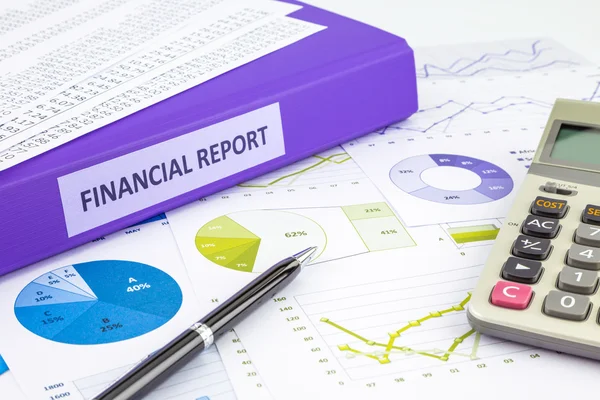
Purple binder of financial report place on graphs and charts analysis or business reports, concept to budget management
Financial report and graph analysis for budget management — Stock Photo, Image
Closeup of financial statements, annual reports with modern pen and calculator in flame, black and white tone. Concepts of accounting, audit evaluation and business marketing.
Accounting and audit evaluation of financial statements. — Stock Photo, Image
Laptop and pen with blue business charts, graphs, statistic and documents background for education and business concepts
Laptop and pen with blue business charts, graphs, statistic and — Stock Photo, Image
Financial statements, expend reports with modern pen, calculator, glasses and US money dollar. Concepts of accounting, audit , tax planning and marketing budget management.
Financial planning and marketing budget for accounting. — Stock Photo, Image
Closeup the silver modern pen on calculator and summary financial statement in background, vintage filter. Concepts of tax management and accounting services.
Calculator for tax accounting services, vintage filter. — Stock Photo, Image
Pen on blue charts, graphs, data and reports background for education and business concepts
Blue charts, graphs, data and reports — Stock Photo, Image
Closeup blue graph and chart reports with white keyboard and pen on office table, financial and business concept
Blue graph and chart reports on office table — Stock Photo, Image
Money symbol, group of silver coins stacks put on documents, expense reports and financial summary.
Coins stacks money and reports — Stock Photo, Image

Usage Information

You can use this royalty-free photo "Blue business charts, graphs, information and reports" for personal and commercial purposes according to the Standard or Extended License. The Standard License covers most use cases, including advertising, UI designs, and product packaging, and allows up to 500,000 print copies. The Extended License permits all use cases under the Standard License with unlimited print rights and allows you to use the downloaded stock images for merchandise, product resale, or free distribution.

You can buy this stock photo and download it in high resolution up to 5430x3648. Upload Date: Jul 25, 2014