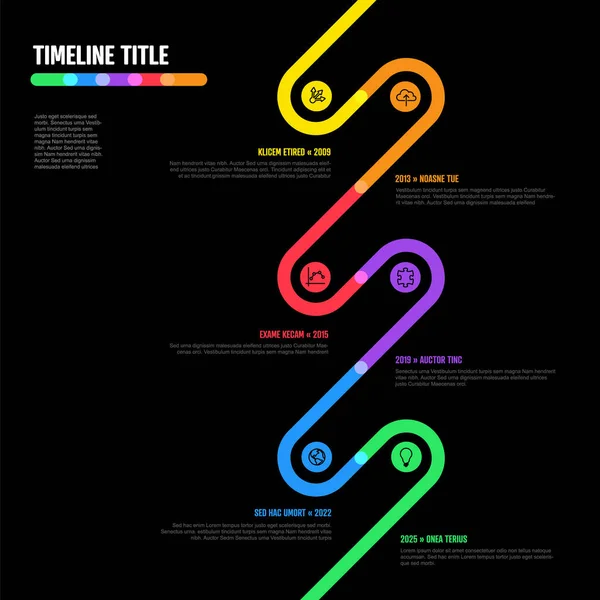
Dark Infographic diagonal timeline report template — Stock Vector

Dark Infographic diagonal timeline report template — Vector

Dark Vector Infographic diagonal timeline report template with icons

 — Vector by orson

Same Series:

Vector multipurpose simple dark progress timeline steps template with descriptions, icons and circles - universal minimalistic infochart time line layout
Vector Multipurpose Simple Dark Progress Timeline Steps Template Descriptions Icons — Stock Vector
Vector Infographic timeline template with horizontal line made from arrows and relief circles with milestones years, icons and various descriptions on dark gray background
Vector Infographic Timeline Template Horizontal Line Made Arrows Relief Circles — Stock Vector
Vector Infographic Company Milestones Timeline Template with icons on a straight diagonal colorful stairs time line and dark background
Timeline template with wide stairs and icons - dark version — Stock Vector
Vector Colorful Infographic typographic timeline report template with the biggest milestones, photos, years and description on blurred city background
Timeline report template — Stock Vector
Infographic Company Milestones Timeline Template with colorful circles and photo placeholders - dark version
Infographic Company Milestones Timeline Template Colorful Circles Photo Placeholders Dark — Stock Vector
Vector colorful Infographic typographic timeline report template with the biggest milestones, years and description - vertical rainbow infochart version with long stripes
Vector Colorful Infographic Typographic Timeline Report Template Biggest Milestones Years — Stock Vector
Vector Infographic timeline report template with the biggest milestones, icons, years and color buttons - vertical time line version
Infographic timeline report template — Stock Vector
Vector Infographic Company Milestones curved vertical Timeline Template. Vivid thick marker time line template version with icons on black background. Thick Color Timeline with curves, icons and text content
Vector Infographic Company Milestones Curved Vertical Timeline Template Vivid Thick — Stock Vector
Vector Infographic Company Milestones curved Timeline Template. Dark time line template version with circles. Thin Color Timeline with curves, icons and text content
Vector Infographic Company Milestones Curved Timeline Template Dark Time Line — Stock Vector
Vector colorful Infographic typographic timeline report template with the biggest milestones, photos, years and description - vertical version
Template with the biggest milestones — Stock Vector
Vector Infographic timeline template with icons made from thin line - dark version
Infographic timeline template — Stock Vector
Vector Infographic Company Milestones Timeline Template. Light thick marker time line template version with icons. Thick Color Timeline with curves, icons and text content
Vector Infographic Company Milestones Timeline Template Light Thick Marker Time — Stock Vector
Vector Infographic timeline report template with the biggest milestones, icons, years and color buttons - vertical time line version
Emplate with the biggest milestones — Stock Vector
Vector light Infographic template with white rounded colorful cards with light border in one row with icons titles and descriptions. Simple minimalistic time line steps template
Vector Light Infographic Template White Rounded Colorful Cards Light Border — Stock Vector
Vector Infographic Company Milestones curved vertical Timeline Template. Dark thick marker time line template version with icons. Thick Color Timeline with curves, icons and text content
Vector Infographic Company Milestones Curved Vertical Timeline Template Dark Thick — Stock Vector
Vector Infographic timeline template made from thin line circles and icons
Template made from thin line circles and icons — Stock Vector

Similar Stock Videos:

Colorful corporate infographic elements bundle. Can be used for workflow, startup, business success, diagram, presentation, banner, teamwork, design, infographic elements set information infographics
Colorful Corporate Infographic Elements — Stock Video
Flowchart infographic, 5 square and empty space for icon and text on white background with map. Timeline diagram template, layout in blue color. Use for business presentation, financial world reports.
Timeline diagram template, layout in blue color. Flowchart infographic with 5 step on white background with map. — Stock Video
Set of graphs in the dynamics of production growth on various coloured backgrounds. Business Data Graph chart increasing revenue with rising arrow
Set Graphs Dynamics Production Growth Various Coloured Backgrounds Business Data — Stock Video
Infographic arrows computer search idea online shopping animation hd
Infographic online shopping — Stock Video
Infographic arrows computer search idea online shopping animation hd
Infographic online shopping — Stock Video
Colorful corporate infographic elements bundle. Can be used for workflow, startup, business success, diagram, presentation, banner, teamwork, design, infographic elements set information infographics
Colorful Corporate Infographic Elements — Stock Video
Big Infographics set. Animation of different charts and graphs in orange and gray colors. 4K resolution animation.
Big Infographics set. Animation of different charts and graphs in orange and gray colors. 4K resolution animation — Stock Video
Bar graph with axis, pie and venn diagrams. Grow chart business concept. Animation for yours big data presentation. 4K video clip.
Bar graph with axis. Animation. — Stock Video
Flow chart infographic with 5 square and empty space for icon and text on background with map. Timeline diagram template, layout in different colors. Use for business financial presentations, reports.
Flow chart infographic with 5 step on white background with map. Timeline diagram template, layout . — Stock Video
Animation of Covid-19 Stock Market Crash written over chart and statistics showing financial data on purple background. Global finance and stock market crisis and recession coronavirus Covid pandemic concept digitally generated image.
Animation Covid Stock Market Crash Written Chart Statistics Showing Financial — Stock Video
Animation of Covid-19 Stock Market Crash written over chart and statistics showing financial data on green background. Global finance and stock market crisis and recession coronavirus Covid pandemic concept digitally generated image.
Animation Covid Stock Market Crash Written Chart Statistics Showing Financial — Stock Video
Collection of infographic elements in the popular line style.
Infographic Elements In The Line Style. Yellow Spot — Stock Video

Usage Information

You can use this royalty-free vector image "Dark Infographic diagonal timeline report template" for personal and commercial purposes according to the Standard or Extended License. The Standard License covers most use cases, including advertising, UI designs, and product packaging, and allows up to 500,000 print copies. The Extended License permits all use cases under the Standard License with unlimited print rights and allows you to use the downloaded vector files for merchandise, product resale, or free distribution.

This stock vector image is scalable to any size. You can buy and download it in high resolution up to 4716x3400. Upload Date: Aug 25, 2014