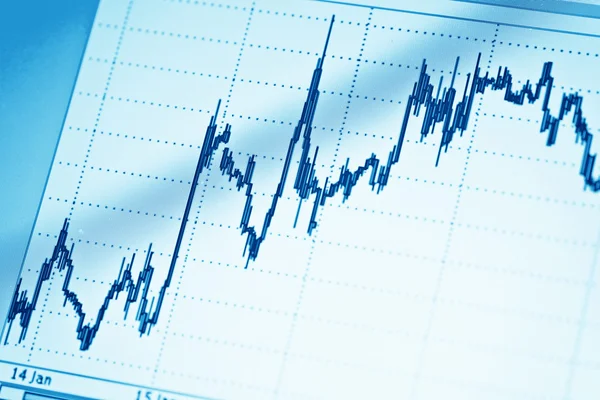
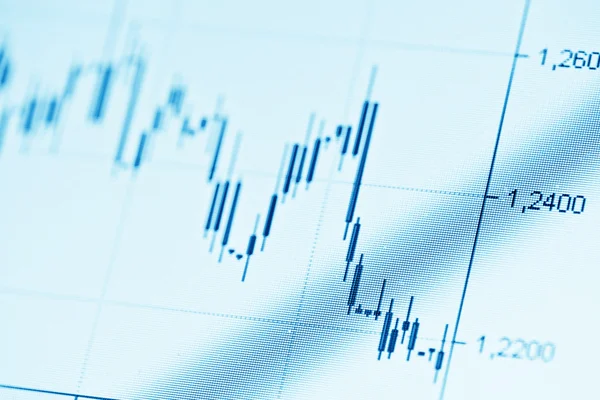
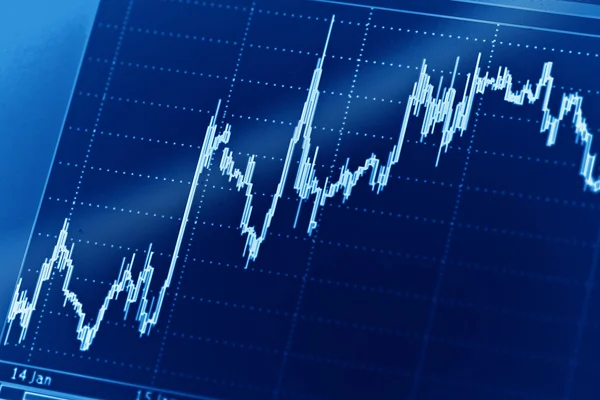
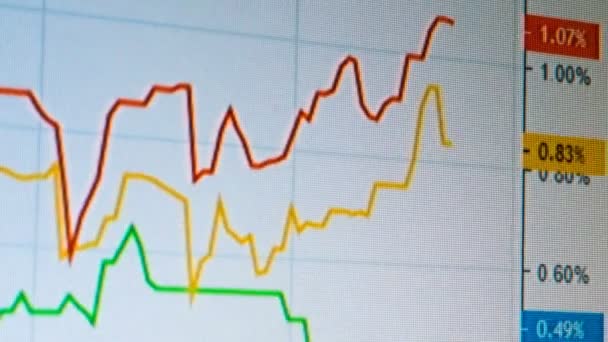
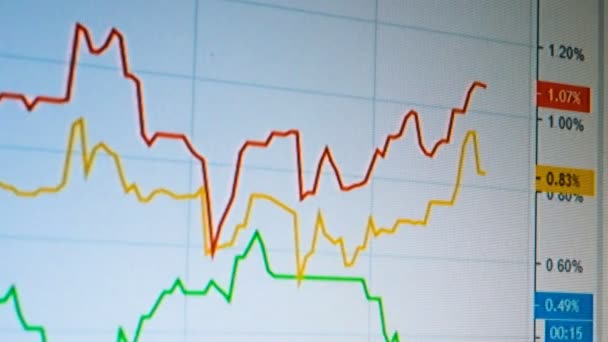
Stock market graphs — Stock Photo, Image

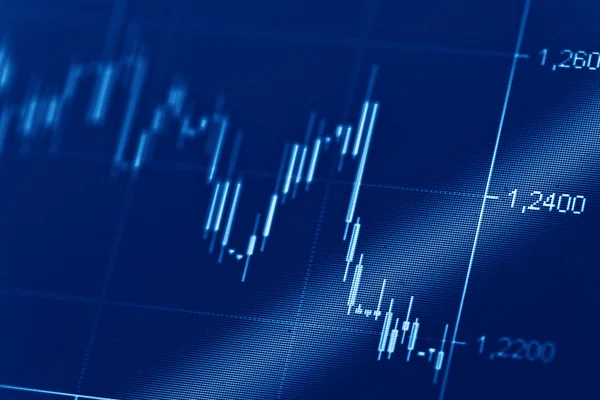
Stock market graphs — Photo

Stock market graphs background

 — Photo by valphoto

Similar Stock Videos:

Stock exchange market data on screen with graph
Stock exchange data on screen — Stock Video
Digital screen with updating stats, number of sales, percentage, growth, decline. Business candle stick graph chart of stock market investment trading. Bullish point. Trend of graph
Digital screen with updating stats, number of sales, percentage, growth, decline. Business candle stick graph chart of stock market investment trading. Bullish point. Trend of graph. — Stock Video
Abstract digital network data background, 3D rendering
Abstract Digital Network Data Background Rendering — Stock Video
Stock exchange market data on screen with graph
Stock exchange data on screen — Stock Video
Growth up stock markets chart 3d loop animation. Success, rising business and financial graph, economy data diagram and money investment analysis loopable and seamless abstract concept.
Growth Stock Markets Chart Loop Animation Success Rising Business Financial — Stock Video
Abstract digital network data background, 3D rendering
Abstract Digital Network Data Background Rendering — Stock Video
Abstract digital network data background, 3D rendering
Abstract Digital Network Data Background Rendering — Stock Video
Animation of schematic Intensive Care Unit monitor showing normal values for vital signs. Focused on blood pressure diagram. White background.
Intensive Care Unit monitor — Stock Video
Stock market trend graph
Stock market trend graph — Stock Video
Stock market trend graph
Stock market trend graph — Stock Video
Abstract digital network data background, 3D rendering
Abstract Digital Network Data Background Rendering — Stock Video
Success in business. Growth Indicators in Business 8
Success in business. Growth Indicators in Business. 8 — Stock Video
Two Growing charts on white background. Financial figures and number showing increasing profits.
Two Growing charts on white background. Financial figures and number showing increasing profits. — Stock Video
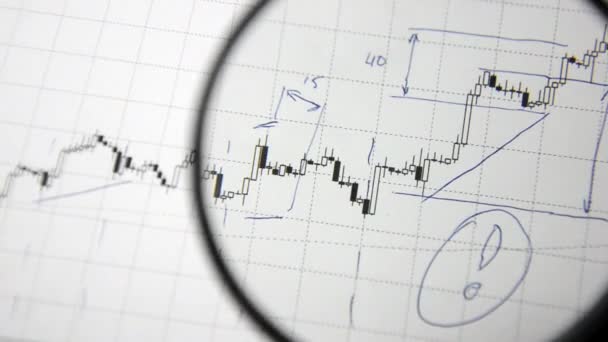
The analysis of price movements. (Graphs and diagrams with a magnifying glass)
The analysis of price movements. — Stock Video
Graph of Internet Trading Crypto Currency. Live chart on the Internet exchange Bitcoin to dollar. Financial concept and background of Internet trading. Exchange online quotes. Flow of economic
Graph of Internet Trading Crypto Currency — Stock Video
Live Graph Chart of Internet Trading of Currency. Internet exchange Dollar to Bitcoin. Financial concept and background of Internet trading. Exchange online quotes. The flow of economic investments.
Live Graph Chart of Internet Trading of Currency — Stock Video
Drawing colored lines on the screen
Drawing Colored Lines Screen — Stock Video
Bitcoin price rise on a candlestick chart crypto asset bull run to 9000 dollars in a bullish uptrend blockchain cryptocurrency adoption e commerce and finance in stock market concept 3d animation
Bitcoin Price Rise Candlestick Chart Crypto Asset Bull Run 9000 — Stock Video

Usage Information

You can use this royalty-free photo "Stock market graphs" for personal and commercial purposes according to the Standard or Extended License. The Standard License covers most use cases, including advertising, UI designs, and product packaging, and allows up to 500,000 print copies. The Extended License permits all use cases under the Standard License with unlimited print rights and allows you to use the downloaded stock images for merchandise, product resale, or free distribution.

You can buy this stock photo and download it in high resolution up to 7360x4912. Upload Date: Feb 3, 2015