Charts of Financial Instruments — Stock Photo, Image

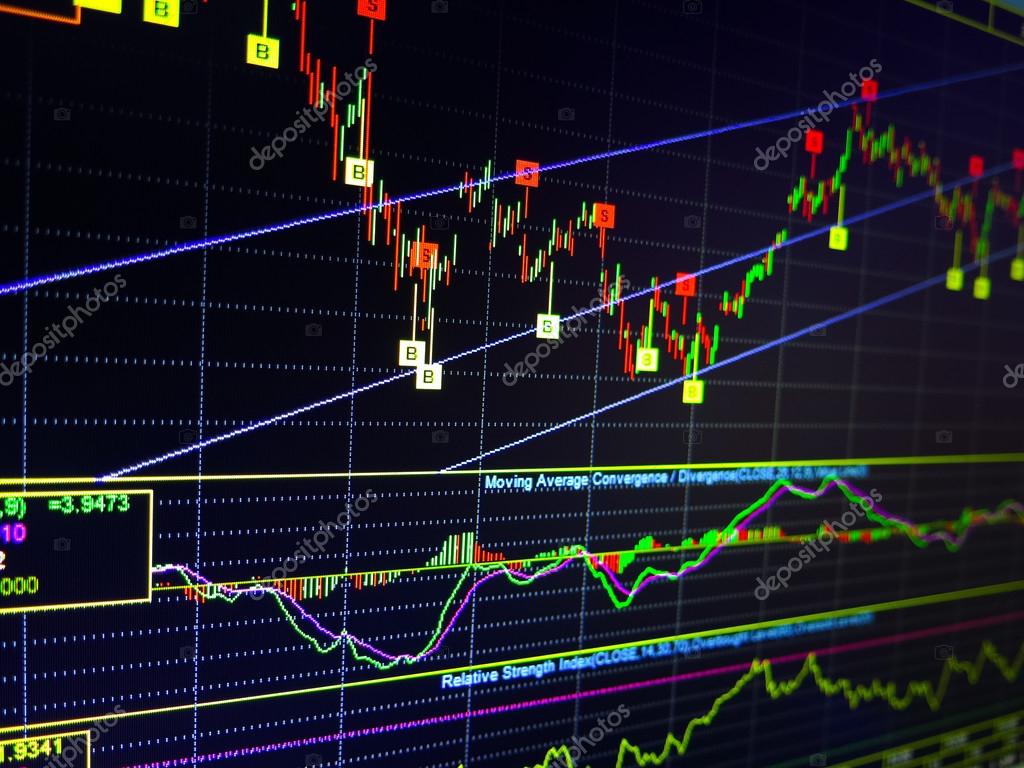
Charts of Financial Instruments — Photo

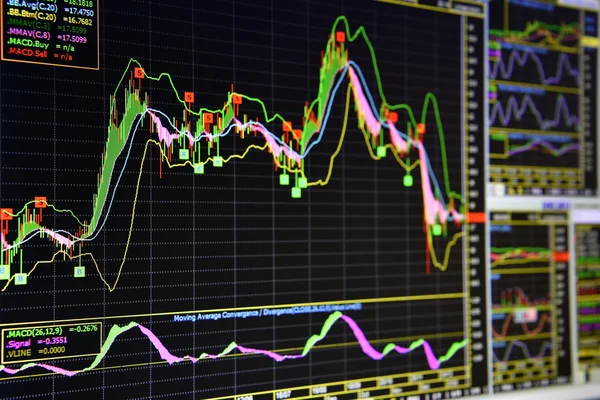
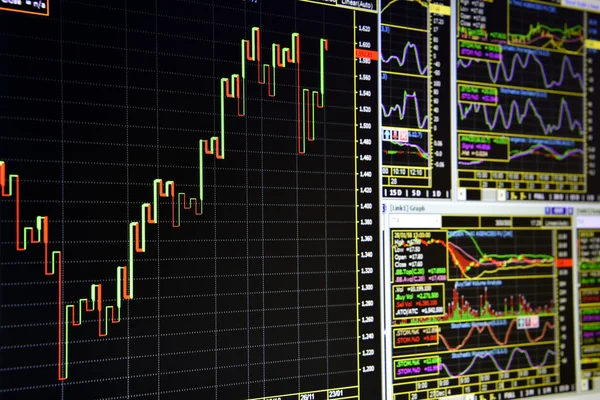
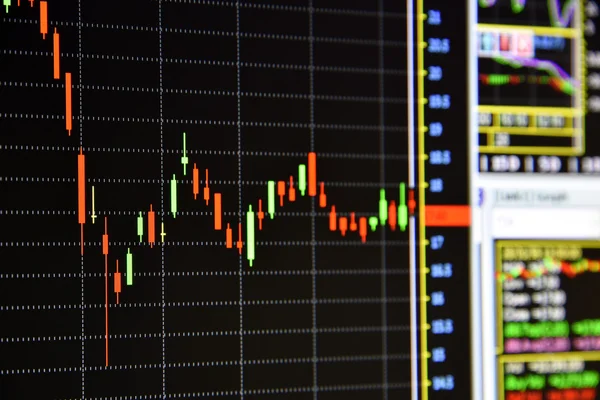
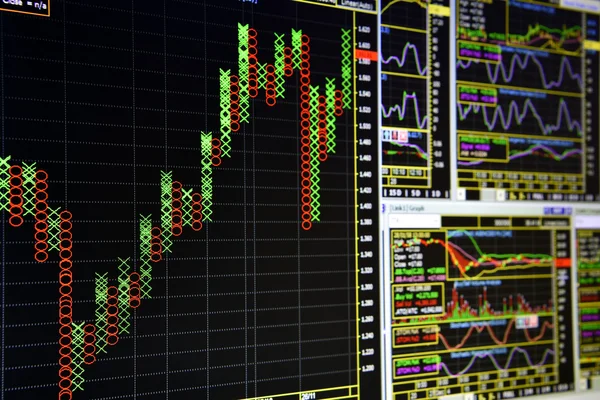
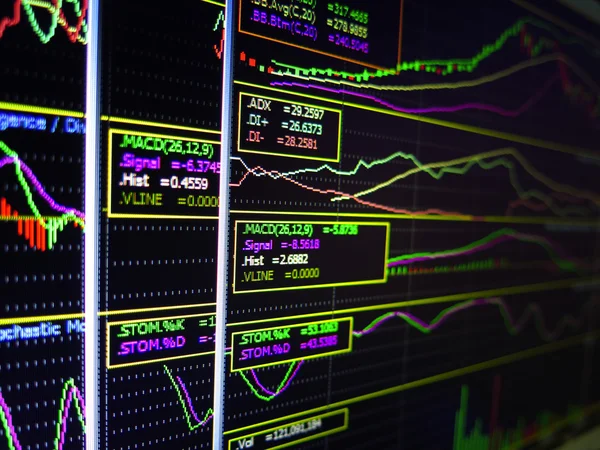
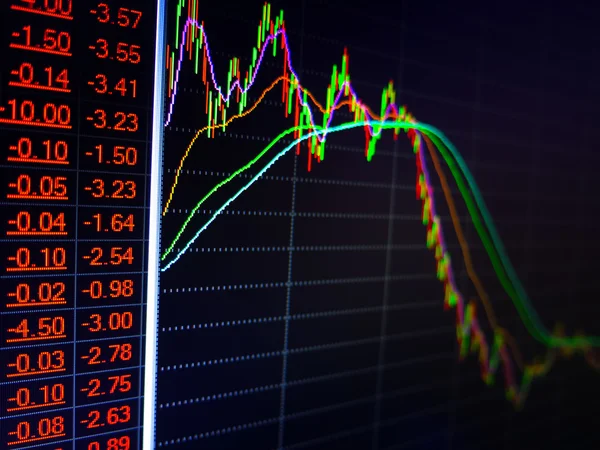
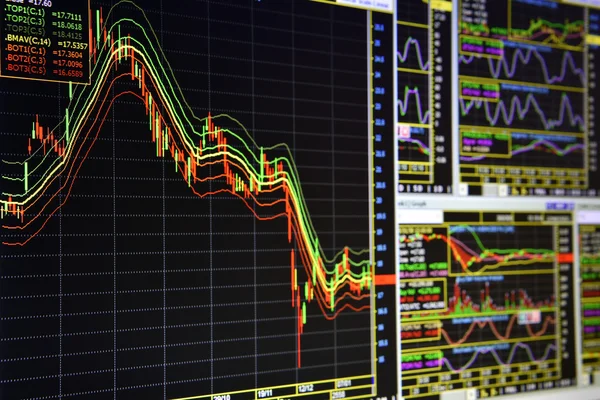
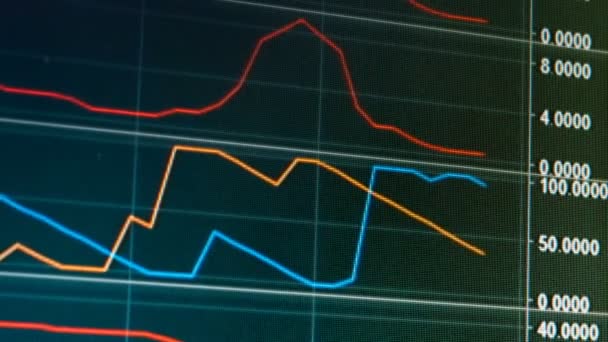
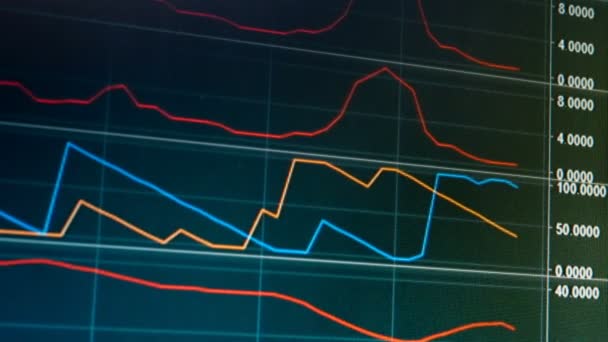
Charts of financial instruments with various type of indicators for technical analysis on the monitor of a computer

 — Photo by wisitporn

Same Series:

Charts of financial instruments with various type of indicators for technical analysis on the monitor of a computer
Charts of Financial Instruments on the monitor of a computer. — Stock Photo, Image
Charts of financial instruments with various type of indicators for technical analysis on the monitor of a computer
Charts of Financial Instruments — Stock Photo, Image
Charts of financial instruments with various type of indicators for technical analysis on the monitor of a computer
Charts of Financial Instruments — Stock Photo, Image
Charts of financial instruments with various type of indicators for technical analysis on the monitor of a computer
Charts of Financial Instruments — Stock Photo, Image
Charts of financial instruments with various type of indicators for technical analysis on the monitor of a computer.
Charts of financial Instruments on the monitor of a computer. — Stock Photo, Image
Charts of financial instruments with various type of indicators for technical analysis on the monitor of a computer.
Charts of financial Instruments on the monitor of a computer. — Stock Photo, Image
Charts of financial instruments with various type of indicators for technical analysis on the monitor of a computer.
Charts of financial Instruments on the monitor of a computer. — Stock Photo, Image
Charts of financial instruments with various type of indicators for technical analysis on the monitor of a computer.
Charts of financial Instruments on the monitor of a computer. — Stock Photo, Image
Charts of financial instruments with various type of indicators for technical analysis on the monitor of a computer
Charts of Financial Instruments — Stock Photo, Image
Charts of financial instruments with various type of indicators for technical analysis on the monitor of a computer
Charts of Financial Instruments — Stock Photo, Image
Charts of financial instruments with various type of indicators for technical analysis on the monitor of a computer
Charts of Financial Instruments on the monitor of a computer. — Stock Photo, Image
Charts of financial instruments with various type of indicators for technical analysis on the monitor of a computer
Charts of Financial Instruments on the monitor of a computer. — Stock Photo, Image
Charts of financial instruments with various type of indicators for technical analysis on the monitor of a computer.
Charts of Financial Instruments on the monitor of a computer. — Stock Photo, Image
Screen of financial activities on the monitor of a computer
Financial Activities on a Computer. — Stock Photo, Image
Charts of financial instruments with various type of indicators for technical analysis on the monitor of a computer.
Charts of financial Instruments on the monitor of a computer. — Stock Photo, Image
Charts of financial instruments with various type of indicators for technical analysis on the monitor of a computer
Charts of Financial Instruments on the monitor of a computer. — Stock Photo, Image

Similar Stock Videos:

Curves moving on electronic diagram, statistical data analysis presentation
Curves moving on electronic diagram, statistical data analysis presentation — Stock Video
Curves moving on electronic diagram, statistical data analysis presentation
Curves moving on electronic diagram, statistical data analysis presentation — Stock Video
A virtual status with financial data and charts.
Charts, figures and data. — Stock Video
Animation of stock market display with green, pink and blue stock market tickers and graphs, price going up and down at the stock exchange on black background.
Animation Stock Market Display Green Pink Blue Stock Market Tickers — Stock Video
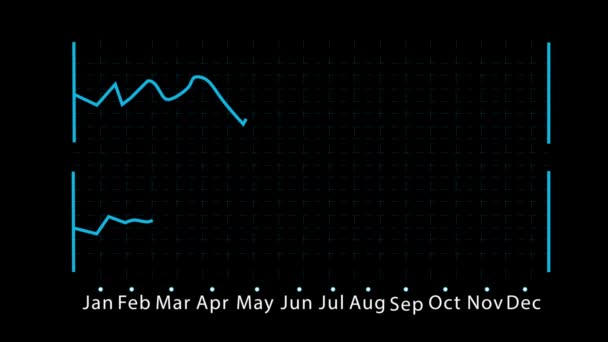
Two lines representing different stocks fluctuate up and down as they move forward in time on a monthly chart. Black background
Stock market graph ups and downs. Black background — Stock Video
Live Graph Chart of Internet Trading of Currency. Internet exchange Dollar to Bitcoin. Financial concept and background of Internet trading. Exchange online quotes. The flow of economic investments.
Live Graph Chart of Internet Trading of Currency — Stock Video
Live Graph Chart of Internet Trading of Currency. Internet exchange Dollar to Bitcoin. Financial concept and background of Internet trading. Exchange online quotes. The flow of economic investments.
Live Graph Chart of Internet Trading of Currency — Stock Video
Growth up stock markets green chart 3d loop animation. Success, rising business and financial graph, economy data diagram and money investment analysis loopable and seamless abstract concept.
Growth Stock Markets Green Chart Loop Animation Success Rising Business — Stock Video
Stock market indices are moving in the virtual space. Economic growth, recession. Electronic virtual platform showing trends and stock market fluctuations. looped
Stock Market Indices Moving Virtual Space Economic Growth Recession Electronic — Stock Video
Digital animation of interface codes. The background has molecular structures and geometric shapes
Digital Animation Interface Codes Background Has Molecular Structures Geometric Shapes — Stock Video
A virtual status with financial data and charts.
Charts, figures and data. — Stock Video
Digital animation of a geometric square made of lines. The background has grid lines with molecular structures and interface codes
Digital Animation Geometric Square Made Lines Background Has Grid Lines — Stock Video
Dance of color patterns on the screen
Dance Color Patterns Screen — Stock Video
Heart rate monitor. Animation of heart rate monitor concept
Heart rate monitor. Animation of heart rate monitor concept — Stock Video
Stock market or forex trading graph and candlestick chart suitable for financial investment concept. Economy trends background for business idea and all art work design. Abstract finance background.
Stock Market Forex Trading Graph Candlestick Chart Suitable Financial Investment — Stock Video
Business background. Stock Market Chart on Dark Background.
Business background. Stock Market Chart — Stock Video
Figures changing, graphical representation of data for company yearly report
Figures changing, graphical representation of data for company yearly report — Stock Video
Figures changing, graphical representation of data for company yearly report
Figures changing, graphical representation of data for company yearly report — Stock Video

Usage Information

You can use this royalty-free photo "Charts of Financial Instruments" for personal and commercial purposes according to the Standard or Extended License. The Standard License covers most use cases, including advertising, UI designs, and product packaging, and allows up to 500,000 print copies. The Extended License permits all use cases under the Standard License with unlimited print rights and allows you to use the downloaded stock images for merchandise, product resale, or free distribution.

You can buy this stock photo and download it in high resolution up to 4000x3000. Upload Date: Mar 7, 2015