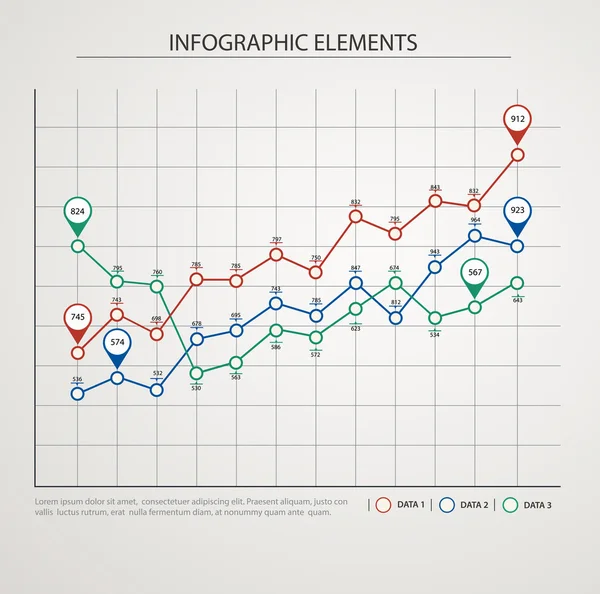
Green business chart graph with two lines of increase — Stock Vector

Green business chart graph with two lines of increase — Vector

Green business chart graph with two lines of increase

 — Vector by Ramcreative

Same Series:

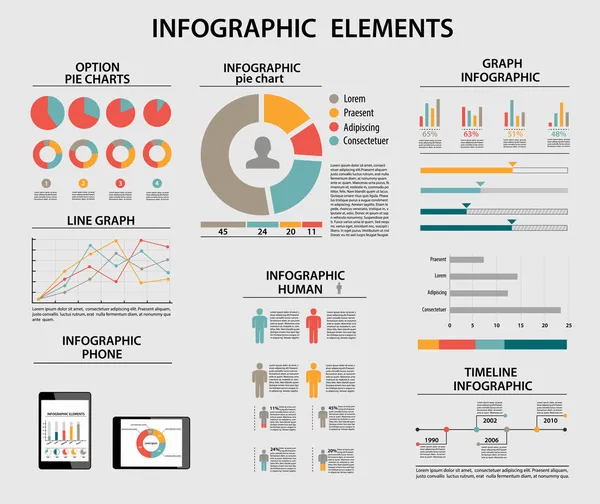
Elements of infographics with colored graphics.
Elements of infographics with colored graphics. — Stock Vector
Timeline, infographics template with stepwise structure
Timeline, infographics template with stepwise structure — Stock Vector
Business elements of infographic, set of statistical data, pie charts, columns, pyramids.
Business elements of infographic, set of statistical data, pie charts, columns, pyramids, graphs in 3d isometric design. — Stock Vector
Business infographic elements, pie charts, timeline, growing graphs
Business infographic elements, pie charts, timeline, growing gra — Stock Vector
Infographics circles 5 options or steps. Business concept, block diagram, information graph, pie chart processes
Infographics Circles Options Steps Business Concept Block Diagram Information Graph — Stock Vector
Presentation business infographic template with 4 options. Business concept with integrated circles. Flowchart, steps, timeline infographics, workflow layout
Presentation business infographic template with 4 options. — Stock Vector
Abstract paper template with stripes. Infographics
Abstract paper template with stripes — Stock Vector
Infographic pyramid with step structure and with percentages. Business concept with 6 options pieces or steps. Block diagram, information graph, presentations banner, workflow.
Infographic Pyramid Step Structure Percentages Business Concept Options Pieces Steps — Stock Vector
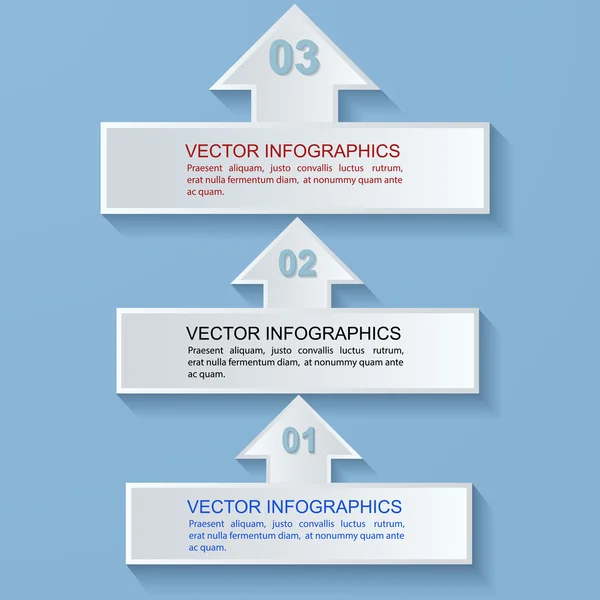
Abstract arrows up. Paper infographics. Perfect for web design, presentations, as a template, layout, advertising
Abstract arrows up. Paper infographics. — Stock Vector
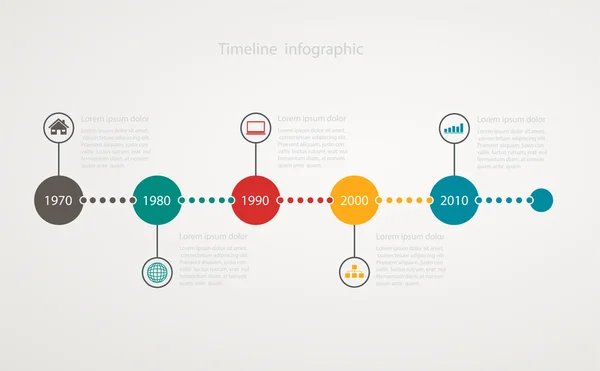
Infographic timeline with icons, step by step anual structure
Infographic timeline with icons, step by step anual structure — Stock Vector
Design Minimal style infographic template. Numbered banners & reports & web design elements & Connected rectangles
Design Minimal style infographic template — Stock Vector
Presentation business infographic template with 4 options. Business concept with integrated circles. Flowchart, steps, timeline infographics, workflow layout
Presentation business infographic template with 4 options. — Stock Vector
SEO optimization and business web analytics. Chart with graph up
SEO optimization and business web analytics. Chart with graph up — Stock Vector
Infographics circles 6 options or steps. Business concept, block diagram, information graph, pie chart processes.
Infographics Circles Options Steps Business Concept Block Diagram Information Graph — Stock Vector
Presentation business infographic template with 4 options. Business concept with integrated circles. Flowchart, steps, timeline infographics, workflow layout
Presentation business infographic template with 4 options. — Stock Vector
Business graphs and charts set. Analysis and management of financial assets. Information on charts, statistical data. Growth and falling on Information graphics infographics.
Business graphs and charts set. Analysis and management — Stock Vector

Similar Stock Videos:

4K financial stock chart,Business digital Data trend hud Graph,Stock Market,Changing Economic node line.
4K financial stock chart,Business Data trend hud Graph,Economic node line. — Stock Video
Computer generated image. HD 16:9 1920 x 1080 at 25.00 fps. Progressive scan. Photo JPG Compression. No audio.
Chart 3D — Stock Video
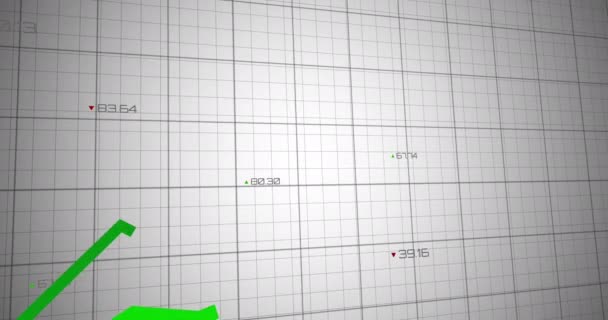
Animation of three green statistic lines over a grey grid with numbers and markers increasing on digital display. Global finances and statistics concept digitally generated image.
Animation Three Green Statistic Lines Grey Grid Numbers Markers Increasing — Stock Video
Animation of green lines and data processing over grid. global business, data processing and connections concept digitally generated video.
Animation Green Lines Data Processing Grid Global Business Data Processing — Stock Video
Animation of green lines and data processing over grid. global business, data processing and connections concept digitally generated video.
Animation Green Lines Data Processing Grid Global Business Data Processing — Stock Video
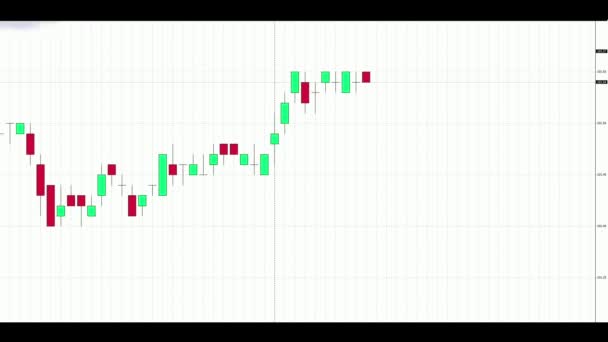
Diagrams present rapidly changing values of stock market indicies. Charts on a white background. The analysis of price movements. Graphs and diagrams
Graphs and diagrams — Stock Video
4K financial stock chart,Business digital Data trend hud Graph,Stock Market,Changing Economic node line.
4K financial stock chart,Business Data trend hud Graph,Economic node line. — Stock Video
Animation of green lines and data processing over grid. global business, data processing and connections concept digitally generated video.
Animation Green Lines Data Processing Grid Global Business Data Processing — Stock Video
Corporate graphics animation user interface. Great for on-screen movies or presentations. High quality FullHD footage
Corporate graphics animation user interface. Great for on-screen movies or presentations. — Stock Video
Animation of green lines and statistics processing over grid. global business, connections, data processing and technology concept digitally generated video.
Animation Green Lines Statistics Processing Grid Global Business Connections Data — Stock Video
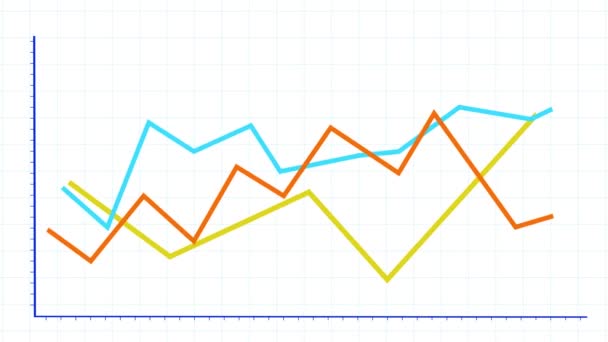
Line graph with axis. Grow chart business concept. Animation for yours presentation.
Line graphs with axis. Animation. — Stock Video
Animation of green lines over grid and data processing. global finances, business and data processing concept digitally generated video.
Animation Green Lines Grid Data Processing Global Finances Business Data — Stock Video
Business Stats And Infographics Layout/ 4k animation of a flat design business and annual market data analysis and reports, with graphic lines and dots
Business Stats Infographics Layout Animation Flat Design Business Annual Market — Stock Video
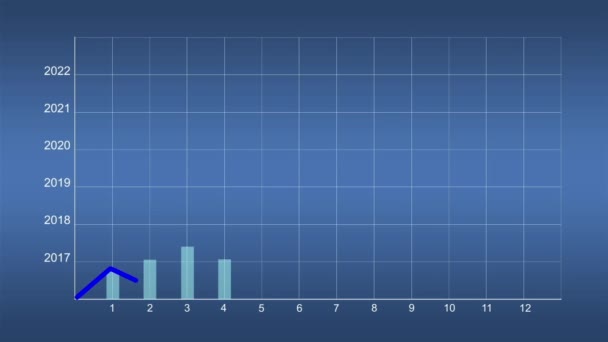
Graphic bars animation economic indicators 4K UHD
Graphic Bars Animation Economic Indicators Uhd — Stock Video
4k Motion Animation of a Stock Exchange Bull Market Melt Up Uptrend Light Background
Motion Animation Stock Exchange Bull Market Melt Uptrend Light Background — Stock Video
Animation of a business infographics with rising two arrow and bar stats appearing, symbolizing growth and success
Business growth and success two arrow infographics — Stock Video
Line graph with axis. Fall chart business concept. Animation for yours presentation.
Line graphs with axis. Animation. — Stock Video

Usage Information

You can use this royalty-free vector image "Green business chart graph with two lines of increase" for personal and commercial purposes according to the Standard or Extended License. The Standard License covers most use cases, including advertising, UI designs, and product packaging, and allows up to 500,000 print copies. The Extended License permits all use cases under the Standard License with unlimited print rights and allows you to use the downloaded vector files for merchandise, product resale, or free distribution.

This stock vector image is scalable to any size. You can buy and download it in high resolution up to 6675x4805. Upload Date: Apr 26, 2015