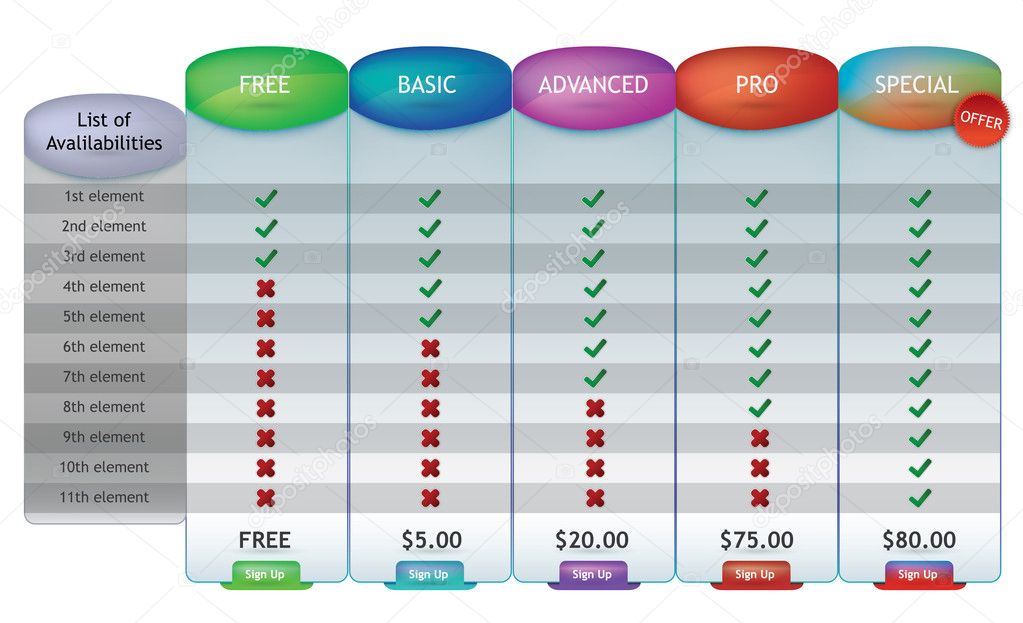
Web price chart — Stock Vector

Web price chart — Vector

Web price chart of different packages

 — Vector by levente

Similar Stock Videos:

Brunei population. Population of Brunei. Population in Brunei. chart. graph. rating. total. pyramid. density. growth rate. 2019. 2018. 2017. 2015. 2014. 2011. 2010. 2000.
Population of Brunei. Population in Brunei. chart. graph. rating. total. — Stock Video
Andorra population. Population of Andorra. Population in Andorra. chart. graph. rating. total. pyramid. density. growth rate. 2019. 2018. 2017. 2015. 2014. 2011. 2010. 2000.
Population of Andorra. Population in Andorra. chart. graph. rating. total. — Stock Video
San marino population. Population of San marino. Population in San marino. chart. graph. rating. total. pyramid. density. growth rate. 2019. 2018. 2017. 2015. 2014. 2011. 2010. 2000.
Population of San marino. Population in San marino. chart. graph. rating. total. — Stock Video
Animation of Covid-19 Stock Market Crash written over chart and statistics showing financial data on green background. Global finance and stock market crisis and recession coronavirus Covid pandemic concept digitally generated image.
Animation Covid Stock Market Crash Written Chart Statistics Showing Financial — Stock Video
Seychelles population. Population of Seychelles. Population in Seychelles. chart. graph. rating. total. pyramid. density. growth rate. 2019. 2018. 2017. 2015. 2014. 2011. 2010. 2000.
Population of Seychelles. Population in Seychelles. chart. graph. rating. total. — Stock Video
Set of graphs in the dynamics of production growth on various coloured backgrounds. Business Data Graph chart increasing revenue with rising arrow
Set Graphs Dynamics Production Growth Various Coloured Backgrounds Business Data — Stock Video
Lichtenstein population. Population of Lichtenstein. Population in Lichtenstein. chart. graph. rating. total. pyramid. density. growth rate. 2019. 2018. 2017. 2015. 2014. 2011. 2010. 2000.
Population of Lichtenstein. Population in Lichtenstein. chart. graph. rating. total. — Stock Video
Saudi arabia population. Population of Saudi arabia. Population in Saudi arabia. chart. graph. rating. total. pyramid. density. growth rate. 2019. 2018. 2017. 2015. 2014. 2011. 2010. 2000.
Population of Saudi arabia. Population in Saudi arabia. chart. graph. rating. total. — Stock Video
Slovak republic population. Population of Slovak republic. Population in Slovak republic. chart. graph. rating. total. pyramid. density. growth rate. 2019. 2018. 2017. 2015. 2014. 2011. 2010. 2000.
Population of Slovak republic. Population in Slovak republic. chart. graph. rating. total. — Stock Video
Singapore population. Population of Singapore. Population in Singapore. chart. graph. rating. total. pyramid. density. growth rate. 2019. 2018. 2017. 2015. 2014. 2011. 2010. 2000.
Population of Singapore. Population in Singapore. chart. graph. rating. total. — Stock Video
Antigua and barbuda population. Population of Antigua and barbuda. Population in Antigua and barbuda. chart. graph. rating. total. pyramid. density. growth rate. 2019. 2018. 2017. 2015. 2014. 2011
Population of Antigua and barbuda. Population in Antigua and barbuda. chart. graph. rating. total. — Stock Video
Liberia population. Population of Liberia. Population in Liberia. chart. graph. rating. total. pyramid. density. growth rate. 2019. 2018. 2017. 2015. 2014. 2011. 2010. 2000.
Population of Liberia. Population in Liberia. chart. graph. rating. total. — Stock Video
Latvia population. Population of Latvia. Population in Latvia. chart. graph. rating. total. pyramid. density. growth rate. 2019. 2018. 2017. 2015. 2014. 2011. 2010. 2000.
Population of Latvia. Population in Latvia. chart. graph. rating. total. — Stock Video
Serbia population. Population of Serbia. Population in Serbia. chart. graph. rating. total. pyramid. density. growth rate. 2019. 2018. 2017. 2015. 2014. 2011. 2010. 2000.
Population of Serbia. Population in Serbia. chart. graph. rating. total. — Stock Video
Lebanon population. Population of Lebanon. Population in Lebanon. chart. graph. rating. total. pyramid. density. growth rate. 2019. 2018. 2017. 2015. 2014. 2011. 2010. 2000.
Population of Lebanon. Population in Lebanon. chart. graph. rating. total. — Stock Video
Lesotho population. Population of Lesotho. Population in Lesotho. chart. graph. rating. total. pyramid. density. growth rate. 2019. 2018. 2017. 2015. 2014. 2011. 2010. 2000.
Population of Lesotho. Population in Lesotho. chart. graph. rating. total. — Stock Video
Libya population. Population of Libya. Population in Libya. chart. graph. rating. total. pyramid. density. growth rate. 2019. 2018. 2017. 2015. 2014. 2011. 2010. 2000.
Population of Libya. Population in Libya. chart. graph. rating. total. — Stock Video
Collection of infographic elements in the popular line style.
Infographic Elements In The Line Style. Yellow Spot — Stock Video

Usage Information

You can use this royalty-free vector image "Web price chart" for personal and commercial purposes according to the Standard or Extended License. The Standard License covers most use cases, including advertising, UI designs, and product packaging, and allows up to 500,000 print copies. The Extended License permits all use cases under the Standard License with unlimited print rights and allows you to use the downloaded vector files for merchandise, product resale, or free distribution.

This stock vector image is scalable to any size. You can buy and download it in high resolution up to 3711x2260. Upload Date: Dec 7, 2011