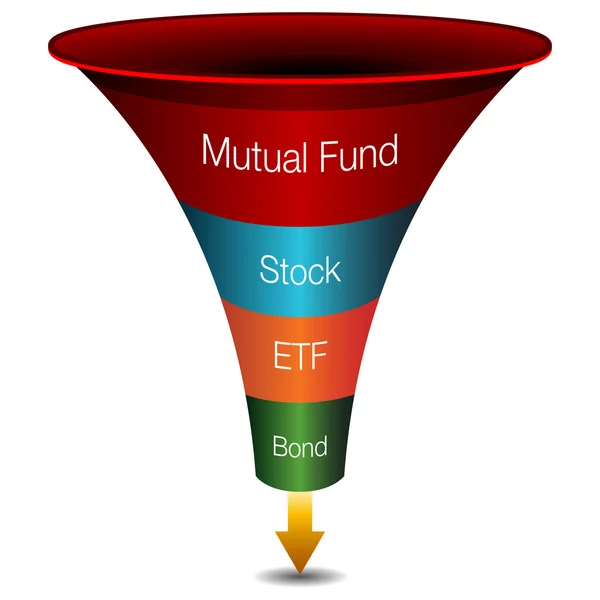
Stock Market Sectors Chart — Stock Vector

Stock Market Sectors Chart — Vector

An image of a stock market sectors chart.

 — Vector by cteconsulting

Similar Stock Videos:

Pie chart in blue, divided into six parts, 3d animation. Black background
Animated pie chart blue 3d hud. Black background — Stock Video
Andorra population. Population of Andorra. Population in Andorra. chart. graph. rating. total. pyramid. density. growth rate. 2019. 2018. 2017. 2015. 2014. 2011. 2010. 2000.
Population of Andorra. Population in Andorra. chart. graph. rating. total. — Stock Video
Pie chart indicated 25/25/25/25 percent, diagram for presentation.
Pie chart indicated 25/25/25/25 percent, diagram for presentation. — Stock Video
Bar graph with axis, pie and venn diagrams. Grow chart business concept. Animation for yours big data presentation. 4K video clip.
Bar graph with axis. Animation. — Stock Video
Brunei population. Population of Brunei. Population in Brunei. chart. graph. rating. total. pyramid. density. growth rate. 2019. 2018. 2017. 2015. 2014. 2011. 2010. 2000.
Population of Brunei. Population in Brunei. chart. graph. rating. total. — Stock Video
Spanish. Mouse Cursor Slides Over And Clicks No in Response to Are You Sure? on Web Page. Device Screen View of Cursor Clicking Unsure Online. Viewpoint Over The Internet Network Website.
Spanish Mouse Cursor Slides Clicks Response You Sure Web Page — Stock Video
Room for a custom logo in the upper left corner of the screen. Titles are of fictional shows.
Simulation of an on-screen interactive television guide menu from a cable or satellite company. — Stock Video
San marino population. Population of San marino. Population in San marino. chart. graph. rating. total. pyramid. density. growth rate. 2019. 2018. 2017. 2015. 2014. 2011. 2010. 2000.
Population of San marino. Population in San marino. chart. graph. rating. total. — Stock Video
Seychelles population. Population of Seychelles. Population in Seychelles. chart. graph. rating. total. pyramid. density. growth rate. 2019. 2018. 2017. 2015. 2014. 2011. 2010. 2000.
Population of Seychelles. Population in Seychelles. chart. graph. rating. total. — Stock Video
Set of graphs in the dynamics of production growth on various coloured backgrounds. Business Data Graph chart increasing revenue with rising arrow
Set Graphs Dynamics Production Growth Various Coloured Backgrounds Business Data — Stock Video
Lichtenstein population. Population of Lichtenstein. Population in Lichtenstein. chart. graph. rating. total. pyramid. density. growth rate. 2019. 2018. 2017. 2015. 2014. 2011. 2010. 2000.
Population of Lichtenstein. Population in Lichtenstein. chart. graph. rating. total. — Stock Video
Bar graph chart with axis illustrated small data business concept. Grow chart animation for yours presentation. 4K motion graphic video clip isolated on white background
Bar graph chart with arrows axis. — Stock Video
Colorful corporate infographic elements bundle. Can be used for workflow, startup, business success, diagram, presentation, banner, teamwork, design, infographic elements set information infographics
Colorful Corporate Infographic Elements — Stock Video
Collection of infographic elements in the popular line style.
Infographic Elements In The Line Style. Yellow Spot — Stock Video
Saudi arabia population. Population of Saudi arabia. Population in Saudi arabia. chart. graph. rating. total. pyramid. density. growth rate. 2019. 2018. 2017. 2015. 2014. 2011. 2010. 2000.
Population of Saudi arabia. Population in Saudi arabia. chart. graph. rating. total. — Stock Video
Serbia population. Population of Serbia. Population in Serbia. chart. graph. rating. total. pyramid. density. growth rate. 2019. 2018. 2017. 2015. 2014. 2011. 2010. 2000.
Population of Serbia. Population in Serbia. chart. graph. rating. total. — Stock Video
Singapore population. Population of Singapore. Population in Singapore. chart. graph. rating. total. pyramid. density. growth rate. 2019. 2018. 2017. 2015. 2014. 2011. 2010. 2000.
Population of Singapore. Population in Singapore. chart. graph. rating. total. — Stock Video
Libya population. Population of Libya. Population in Libya. chart. graph. rating. total. pyramid. density. growth rate. 2019. 2018. 2017. 2015. 2014. 2011. 2010. 2000.
Population of Libya. Population in Libya. chart. graph. rating. total. — Stock Video

Usage Information

You can use this royalty-free vector image "Stock Market Sectors Chart" for personal and commercial purposes according to the Standard or Extended License. The Standard License covers most use cases, including advertising, UI designs, and product packaging, and allows up to 500,000 print copies. The Extended License permits all use cases under the Standard License with unlimited print rights and allows you to use the downloaded vector files for merchandise, product resale, or free distribution.

This stock vector image is scalable to any size. You can buy and download it in high resolution up to 4986x4986. Upload Date: Jan 19, 2012