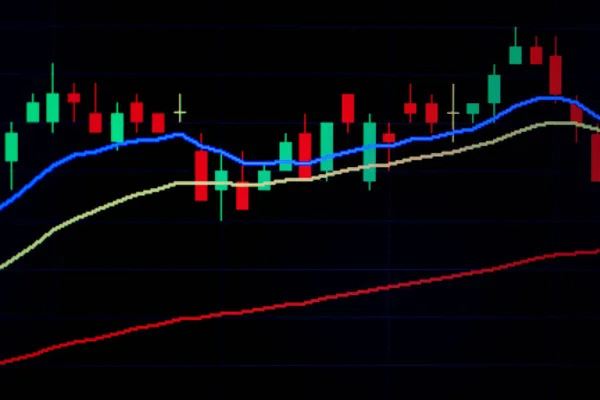
Business Candle Stick Graph Chart Stock Market Investment Trading Background — Stock Photo, Image

Business candle stick graph chart of stock market investment trading on background design / Trend of stock graph market exchange financial economy concept — Photo

Business candle stick graph chart of stock market investment trading on background design / Trend of stock graph market exchange financial economy concept

 — Photo by poringdown@gmail.com

Same Series:

Stock market digital graph chart business indicator stock exchange trading analysis investment financial on display crisis stock crash down and grow up gain and profits financial impact or forex graph
Stock Market Digital Graph Chart Business Indicator Stock Exchange Trading — Stock Photo, Image
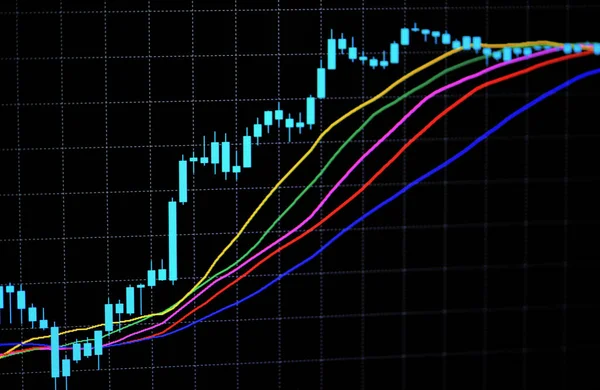
Forex graph business or Stock graph chart market exchange ,Technical price candlestick with indicator on chart computer screen background, Stock trading graphic design for financial investment trade
Forex Graph Business Stock Graph Chart Market Exchange Technical Price — Stock Photo, Image
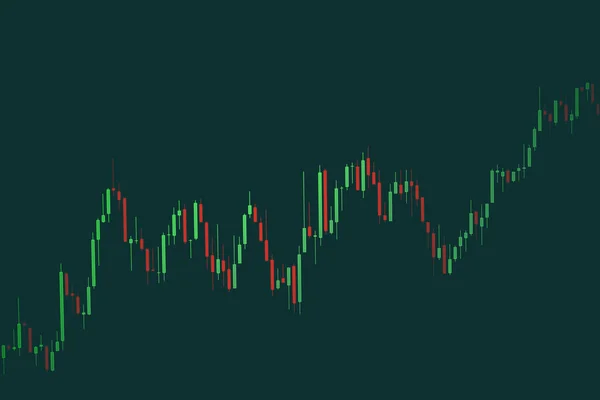
Business candle stick graph chart of stock market investment trading on background design / Trend of stock graph market exchange financial economy concept
Business Candle Stick Graph Chart Stock Market Investment Trading Background — Stock Photo, Image
Stock market digital graph chart business indicator stock exchange trading analysis investment financial on display crisis stock crash down and grow up gain and profits financial impact or forex graph
Stock Market Digital Graph Chart Business Indicator Stock Exchange Trading — Stock Photo, Image
Stock trading graphic design for financial investment trade, Forex graph business or Stock graph chart market exchange ,Technical price candlestick with indicator on chart computer screen background
Stock Trading Graphic Design Financial Investment Trade Forex Graph Business — Stock Photo, Image
Trading crypto currency technical price candlestick with indicator on chart screen, Stock trad graphic design for financial investment trade, Forex graph business or Stock graph chart market exchange
Trading Crypto Currency Technical Price Candlestick Indicator Chart Screen Stock — Stock Photo, Image
Stock market digital graph chart business indicator stock exchange trading analysis investment financial on display crisis stock crash down and grow up gain and profits financial impact or forex graph
Stock Market Digital Graph Chart Business Indicator Stock Exchange Trading — Stock Photo, Image
Stock trading graphic design for financial investment trade, Forex graph business or Stock graph line chart market exchange ,Technical price line with indicator on chart computer screen background
Stock Trading Graphic Design Financial Investment Trade Forex Graph Business — Stock Photo, Image
Blur forex graph business or Stock graph chart market exchange ,Technical price candlestick with indicator on chart computer screen background, Stock trading graphic design for financial investment
Blur Forex Graph Business Stock Graph Chart Market Exchange Technical — Stock Photo, Image
Stock crash market exchange loss trading graph analysis investment indicator business graph charts of financial digital background arrow down stock crisis red price in down trend chart fall
Stock crash market exchange loss trading graph analysis investme — Stock Photo, Image
Stock exchange market or forex trading graph analysis investment indicator / Business graph charts of financial board display candlestick double exposure growth economic digital display
Stock exchange market or forex trading graph analysis investment — Stock Photo, Image
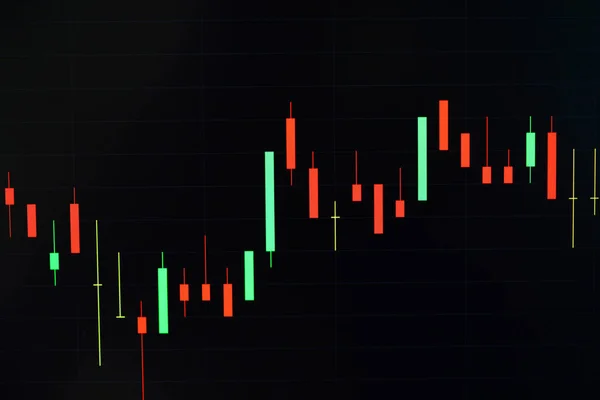
Business candle stick graph chart of stock market investment trading on background design / Trend of stock market graph exchange financial economy concept
Business Candle Stick Graph Chart Stock Market Investment Trading Background — Stock Photo, Image
Stock market digital graph chart business indicator stock exchange trading analysis investment financial on display crisis stock crash down and grow up gain and profits financial impact or forex graph
Stock Market Digital Graph Chart Business Indicator Stock Exchange Trading — Stock Photo, Image
Stock crash market exchange loss trading graph analysis investment indicator business graph charts of financial digital background down stock crisis red price in down trend chart fall /
Stock crash market exchange loss trading graph analysis investme — Stock Photo, Image
Trading crypto currency technical price candlestick with indicator on chart screen, Stock trad graphic design for financial investment trade, Forex graph business or Stock graph chart market exchange
Trading Crypto Currency Technical Price Candlestick Indicator Chart Screen Stock — Stock Photo, Image
Forex trading / forex charts graph board data on desktop screen technical wth indicator tool - Stock exchange market graph analysis background / Money forex trading financial growth concept
Forex Trading Forex Charts Graph Board Data Desktop Screen Technical — Stock Photo, Image

Usage Information

You can use this royalty-free photo "Business candle stick graph chart of stock market investment trading on background design / Trend of stock graph market exchange financial economy concept" for personal and commercial purposes according to the Standard or Extended License. The Standard License covers most use cases, including advertising, UI designs, and product packaging, and allows up to 500,000 print copies. The Extended License permits all use cases under the Standard License with unlimited print rights and allows you to use the downloaded stock images for merchandise, product resale, or free distribution.

You can buy this stock photo and download it in high resolution up to 6016x4016. Upload Date: Oct 6, 2020