Candle stick graph chart with indicator showing bullish point or — Stock Photo, Image

Candle stick graph chart with indicator showing bullish point or — Photo

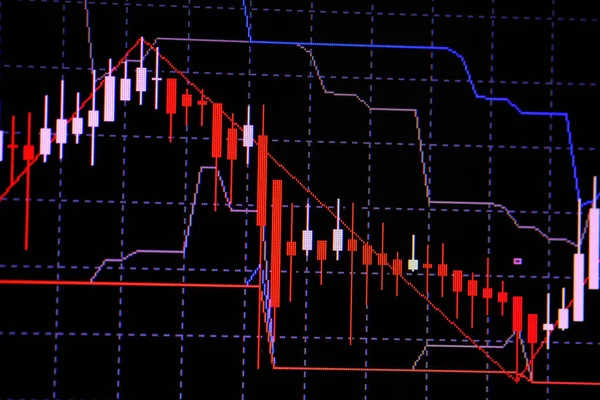
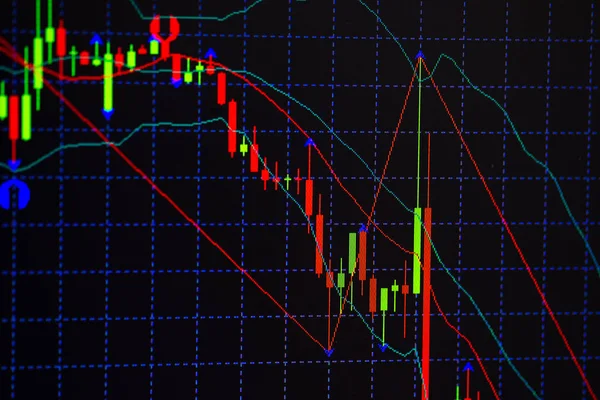
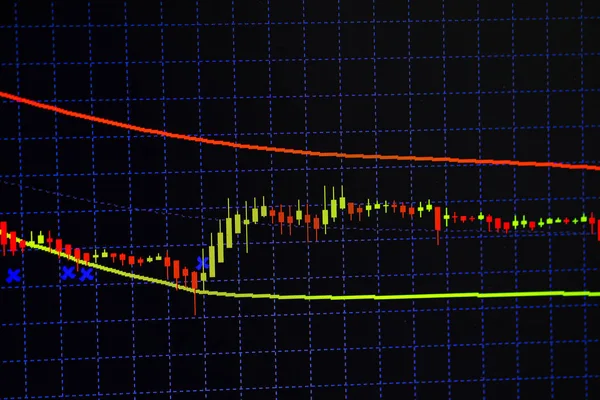
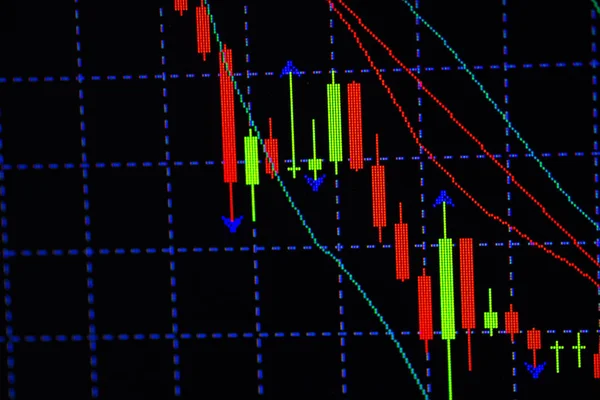
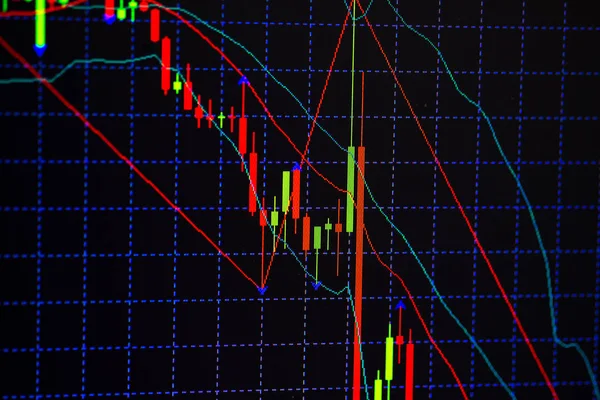
Candle stick graph chart with indicator showing bullish point or bearish point, up trend or down trend of price of stock market or stock exchange trading, investment and financial concept. thin focus.

 — Photo by pookpiik

Same Series:

Candle stick graph chart with indicator showing bullish point or bearish point, up trend or down trend of price of stock market or stock exchange trading, investment and financial concept. thin focus.
Candle stick graph chart with indicator showing bullish point or — Stock Photo, Image
Candle stick graph chart with indicator showing bullish point or bearish point, up trend or down trend of price of stock market or stock exchange trading, investment and financial concept. thin focus.
Candle Stick Graph Chart Indicator Showing Bullish Point Bearish Point — Stock Photo, Image
Candle stick graph chart with indicator showing bullish point or bearish point, up trend or down trend of price of stock market or stock exchange trading, investment and financial concept.
Candle Stick Graph Chart Indicator Showing Bullish Point Bearish Point — Stock Photo, Image
Candle stick graph chart with indicator showing bullish point or bearish point, up trend or down trend of price of stock market or stock exchange trading, investment and financial concept. thin focus.
Candle stick graph chart with indicator showing bullish point or — Stock Photo, Image
Candle stick graph chart with indicator showing bullish point or bearish point, up trend or down trend of price of stock market or stock exchange trading, investment and financial concept. thin focus.
Candle stick graph chart with indicator showing bullish point or — Stock Photo, Image
Candle stick graph chart with indicator showing bullish point or bearish point, up trend or down trend of price of stock market or stock exchange trading, investment and financial concept. thin focus.
Candle Stick Graph Chart Indicator Showing Bullish Point Bearish Point — Stock Photo, Image
Candle stick graph chart with indicator showing bullish point or bearish point, up trend or down trend of price of stock market or stock exchange trading, investment and financial concept.
Candle stick graph chart with indicator showing bullish point or — Stock Photo, Image
Candle stick graph chart with indicator showing bullish point or bearish point, up trend or down trend of price of stock market or stock exchange trading, investment and financial concept.
Candle stick graph chart with indicator showing bullish point or — Stock Photo, Image
Candle stick graph chart with indicator showing bullish point or bearish point, up trend or down trend of price of stock market or stock exchange trading, investment and financial concept. thin focus.
Candle Stick Graph Chart Indicator Showing Bullish Point Bearish Point — Stock Photo, Image
Candle stick graph chart with indicator showing bullish point or bearish point, up trend or down trend of price of stock market or stock exchange trading, investment and financial concept. thin focus.
Candle stick graph chart with indicator showing bullish point or — Stock Photo, Image
Candle stick graph chart with indicator showing bullish point or bearish point, up trend or down trend of price of stock market or stock exchange trading, investment and financial concept. thin focus.
Candle stick graph chart with indicator showing bullish point or — Stock Photo, Image
Candle stick graph chart with indicator showing bullish point or bearish point, up trend or down trend of price of stock market or stock exchange trading, investment and financial concept.
Candle Stick Graph Chart Indicator Showing Bullish Point Bearish Point — Stock Photo, Image
Candle stick graph chart with indicator showing bullish point or bearish point, up trend or down trend of price of stock market or stock exchange trading, investment and financial concept. thin focus.
Candle stick graph chart with indicator showing bullish point or — Stock Photo, Image
Candle stick graph chart with indicator showing bullish point or bearish point, up trend or down trend of price of stock market or stock exchange trading, investment and financial concept.
Candle Stick Graph Chart Indicator Showing Bullish Point Bearish Point — Stock Photo, Image

Usage Information

You can use this royalty-free photo "Candle stick graph chart with indicator showing bullish point or" for personal and commercial purposes according to the Standard or Extended License. The Standard License covers most use cases, including advertising, UI designs, and product packaging, and allows up to 500,000 print copies. The Extended License permits all use cases under the Standard License with unlimited print rights and allows you to use the downloaded stock images for merchandise, product resale, or free distribution.

You can buy this stock photo and download it in high resolution up to 6016x4016. Upload Date: Oct 24, 2017