Financial Activities on A Computer — Stock Photo, Image

Financial Activities on A Computer — Photo

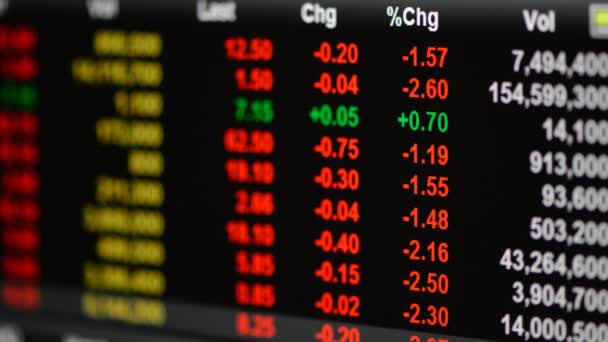
Screen of financial activities on the monitor of a computer

 — Photo by wisitporn

Same Series:

Screen of financial activities on the monitor of a computer
Financial Activities on a Computer. — Stock Photo, Image
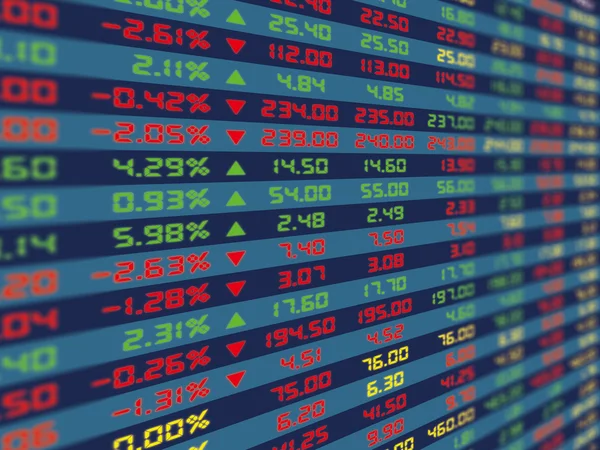
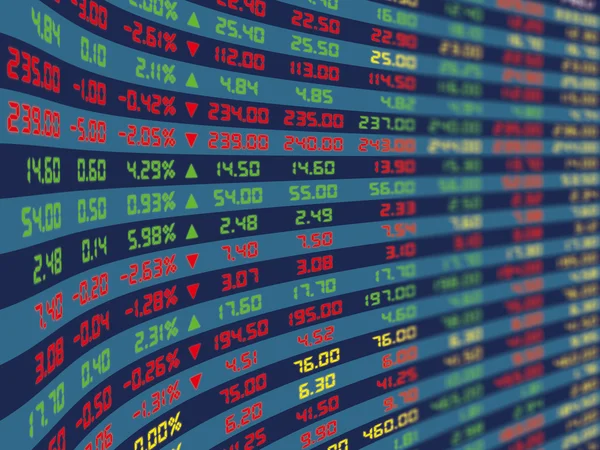
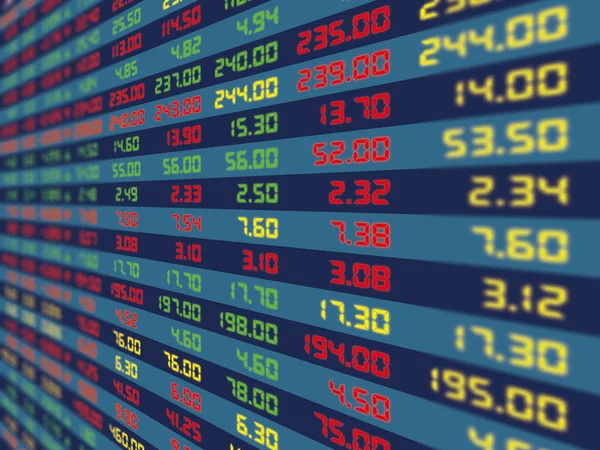
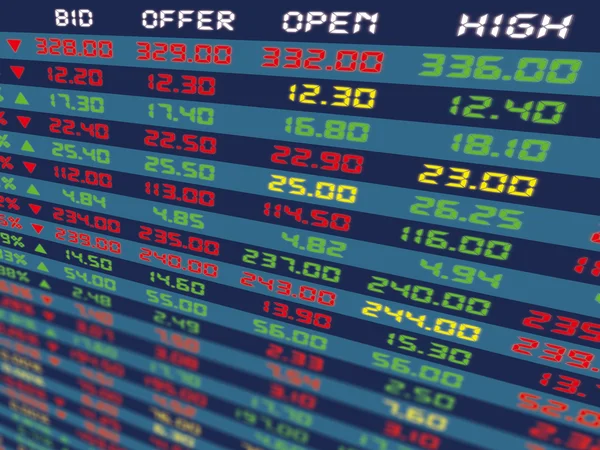
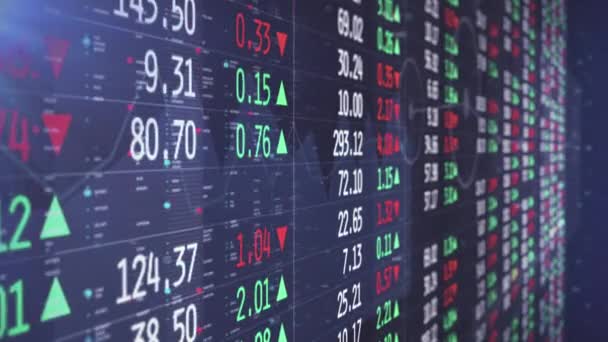
A large display panel of daily stock market price and quotation during normal economic period.
A Display Panel of Daily Stock Market. — Stock Photo, Image
A large display panel of daily stock market price and quotation during normal economic period.
A Display Panel of Daily Stock Market. — Stock Photo, Image
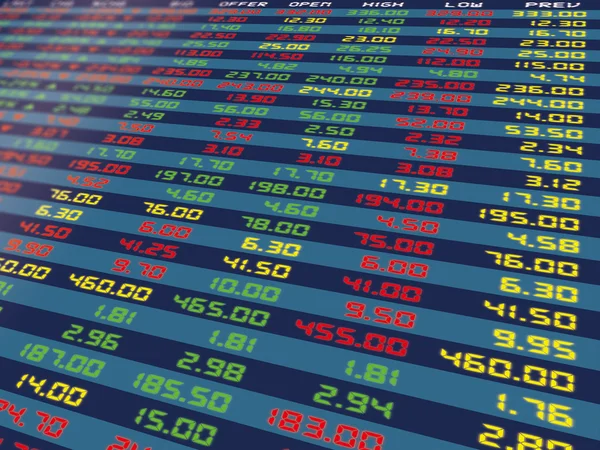
A large display panel of daily stock market price and quotation during normal economic period.
A Display Panel of Daily Stock Market. — Stock Photo, Image
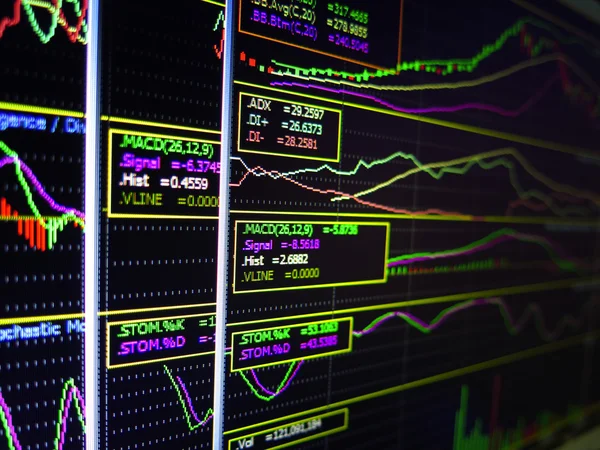
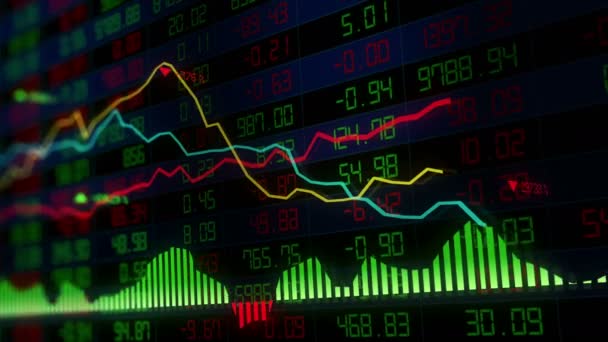
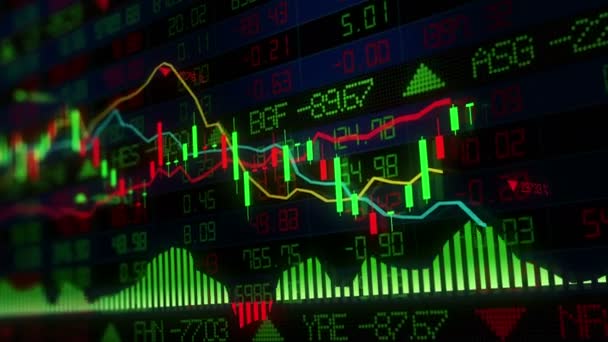
Charts of financial instruments with various type of indicators for technical analysis on the monitor of a computer
Charts of Financial Instruments — Stock Photo, Image
Charts of financial instruments with various type of indicators for technical analysis on the monitor of a computer
Charts of Financial Instruments — Stock Photo, Image
A large display panel of daily stock market price and quotation during normal economic period.
A Display Panel of Daily Stock Market. — Stock Photo, Image
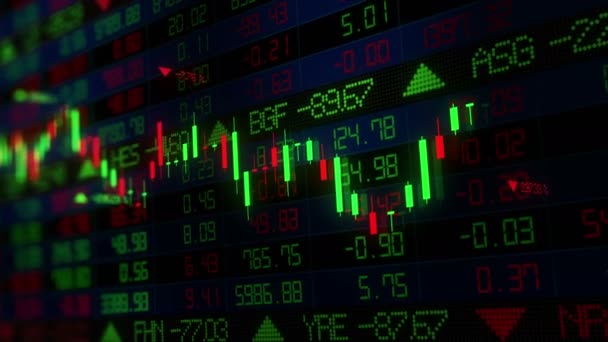
A display of daily stock market price and quotation with a bar chart of financial instrument
A Display of Daily Stock Market . — Stock Photo, Image
Charts of financial instruments with various type of indicators for technical analysis on the monitor of a computer
Charts of Financial Instruments on the monitor of a computer. — Stock Photo, Image
A large display panel of daily stock market price and quotation during normal economic period.
A Display Panel of Daily Stock Market. — Stock Photo, Image
A large display panel of daily stock market price and quotation during normal economic period.
A Display Panel of Daily Stock Market — Stock Photo, Image
A large display panel of daily stock market price and quotation during normal economic period.
A Display Panel of Daily Stock Market. — Stock Photo, Image
Charts of financial instruments with various type of indicators for technical analysis on the monitor of a computer.
Charts of financial Instruments on the monitor of a computer. — Stock Photo, Image
A large display panel of daily stock market price and quotation during normal economic period. Crystal ball decorated concept.
A Display Panel of Daily Stock Market — Stock Photo, Image

Similar Stock Videos:

Stock market trend of animation.
Stock Market 076 — Stock Video
Digital screen of bitcoin dollar price, stock market concept
Digital screen of bitcoin dollar price — Stock Video
Stock market indices are moving in the virtual space. Economic growth, recession. Electronic virtual platform showing trends and stock market fluctuations. looped
Stock Market Indices Moving Virtual Space Economic Growth Recession Electronic — Stock Video
Stock market trading graph and candlestick chart in computer screen. Financial investment concept.
Stock Market Trading Graph Candlestick Chart Computer Screen Financial Investment — Stock Video
Stock market indices are moving in the virtual space. Economic growth, recession. Electronic virtual platform showing trends and stock market fluctuations. looped
Stock Market Indices Moving Virtual Space Economic Growth Recession Electronic — Stock Video
Stock market tickers moving down.
Stock market tickers — Stock Video
Stock Market Tickers. Blue-Orange and Red-Green. . Digital animation of Stock Market prices passing by. Lateral view.
Stock Market Tickers. Blue-Orange and Red-Green. . Digital animation of Stock Market prices passing by. — Stock Video
Stock market trend graph
Stock market trend graph — Stock Video
Stock market or forex trading graph and candlestick chart suitable for financial investment concept. Economy trends background for business idea and all art work design. Abstract finance background.
Stock Market Forex Trading Graph Candlestick Chart Suitable Financial Investment — Stock Video
Stock market indices are moving in the virtual space. Economic growth, recession. Electronic virtual platform showing trends and stock market fluctuations. looped
Stock Market Indices Moving Virtual Space Economic Growth Recession Electronic — Stock Video
Close-up blurred footage of stock exchange electronic board with various numbers
Close Blurred Footage Stock Exchange Electronic Board Various Numbers — Stock Video
Shares Are Traded In The Stock Exchange While Showed On Different Layered Panels With Graphs And Charts
Shares Traded Stock Exchange While Showed Different Layered Panels Graphs — Stock Video
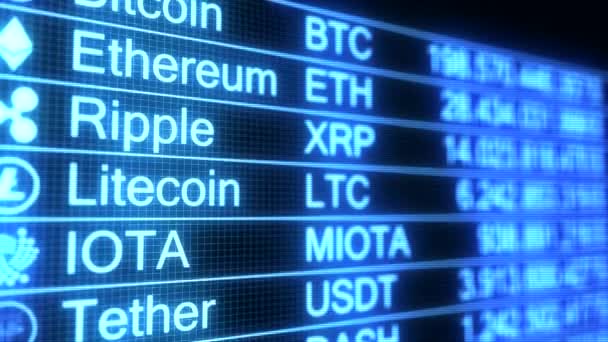
Video animation of crypto currency concept in blue over dark background - Digital currency - Cryptocurrency
Video Animation Crypto Currency Concept Blue Dark Background Digital Currency — Stock Video
Stock market indices are moving in the virtual space. Economic growth, recession. Electronic virtual platform showing trends and stock market fluctuations. looped
Stock Market Indices Moving Virtual Space Economic Growth Recession Electronic — Stock Video
Stock market or forex trading graph and candlestick chart suitable for financial investment concept. Economy trends background for business idea and all art work design. Abstract finance background.
Stock Market Forex Trading Graph Candlestick Chart Suitable Financial Investment — Stock Video
Flight information, cancel and delayed flights.
Flight Information Cancel Delayed Flights — Stock Video
Display of Stock Exchange Showcase 2D Animation 4K
Display Stock Exchange Showcase Animation — Stock Video
Stock market or forex trading graph and candlestick chart suitable for financial investment concept. Economy trends background for business idea and all art work design. Abstract finance background.
Stock Market Forex Trading Graph Candlestick Chart Suitable Financial Investment — Stock Video

Usage Information

You can use this royalty-free photo "Financial Activities on A Computer" for personal and commercial purposes according to the Standard or Extended License. The Standard License covers most use cases, including advertising, UI designs, and product packaging, and allows up to 500,000 print copies. The Extended License permits all use cases under the Standard License with unlimited print rights and allows you to use the downloaded stock images for merchandise, product resale, or free distribution.

You can buy this stock photo and download it in high resolution up to 4000x3000. Upload Date: Mar 7, 2015