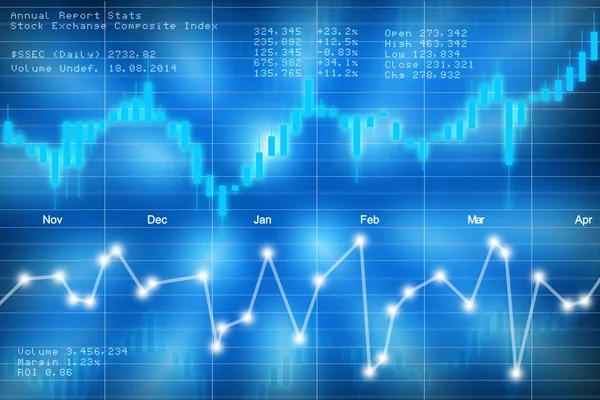
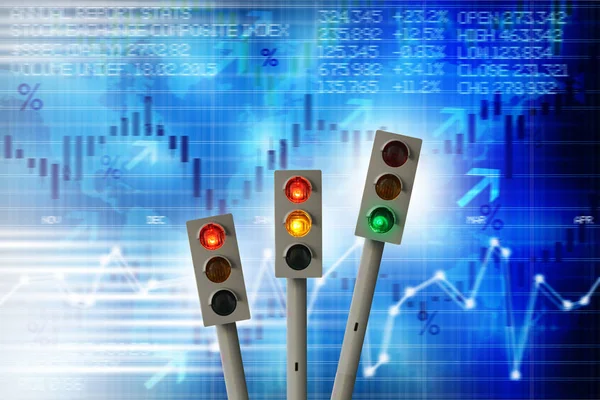
Financial diagram with candlestick chart — Stock Photo, Image

Financial diagram with candlestick chart — Photo

Financial diagram with candlestick chart used in stock market analysis for variation report of share prices

 — Photo by Ai825

Similar Stock Videos:

Animation of computer coding text in white scrolling while a charts and graphs move on a dark blue background behind
Animation Computer Coding Text White Scrolling While Charts Graphs Move — Stock Video
Bar graph about currencies appearing against a wall of data
Bar graph about currencies appearing — Stock Video
Digital composite of blue colored bar chart growing while green dollar symbol rotates in the left corner and stock market data moves on the background
Digital Composite Blue Colored Bar Chart Growing While Green Dollar — Stock Video
Sequence of changing data and computer programming information
Sequence Changing Data Computer Programming Information — Stock Video
Video animation of network on blue background
Video Animation Network Blue Background — Stock Video
Words of the encrypted code in a close up. 4K
Words of the encrypted code in a close up — Stock Video
Animated economical data with a euro sign
Animated economical data — Stock Video
Source code on the monitor screen. Shooting of the text of the computer program.
Source Code Monitor Screen Shooting Text Computer Program — Stock Video
Cloud computing concept. Software source programming code over cloud sky. Developer working on program codes. Technology background. Two layers with different codes. Side angle view.
Cloud computing concept. Software source programming code over cloud sky. Developer working on program codes. Technology background. Two layers with different codes. Side angle view. — Stock Video
Animation of stock market display with blue and green stock market numbers and graphs, price going up and down at the stock exchange, binary coding flowing on blue background.
Animation Stock Market Display Blue Green Stock Market Numbers Graphs — Stock Video
Symbols in perspective and dimension
Formula - Blueprint - Numbers — Stock Video
Digitally generated animation of lights and computer code against a black background
Digitally Generated Animation Lights Computer Code Black Background — Stock Video
Scoreboard with a schedule of flights at the airport.
Scoreboard Schedule Flights Airport — Stock Video
Source code on the monitor screen. Shooting of the text of the computer program.
Source Code Monitor Screen Shooting Text Computer Program — Stock Video
Digital composite of euro symbol rotating in the left corner while blue colored graph grows and stock market data moves against blue background
Digital Composite Euro Symbol Rotating Left Corner While Blue Colored — Stock Video
Stock market pannel, tilt, shine
Stock market pannel, tilt, shine — Stock Video
Computer code. The computer code in the form of blurred.
The computer code in the form of blurred. Computer code. — Stock Video
Digital Data and Numbers passing through cyberspace. All clips are available in multiple color options. All clips loop seamlessly.
Data and Numbers - Data and number values passing through cyberspace. — Stock Video

Usage Information

You can use this royalty-free photo "Financial diagram with candlestick chart" for personal and commercial purposes according to the Standard or Extended License. The Standard License covers most use cases, including advertising, UI designs, and product packaging, and allows up to 500,000 print copies. The Extended License permits all use cases under the Standard License with unlimited print rights and allows you to use the downloaded stock images for merchandise, product resale, or free distribution.

You can buy this stock photo and download it in high resolution up to 5184x3456. Upload Date: Sep 5, 2014