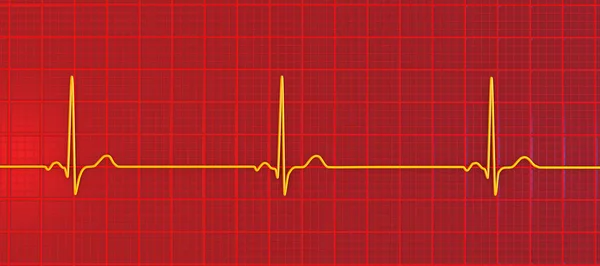
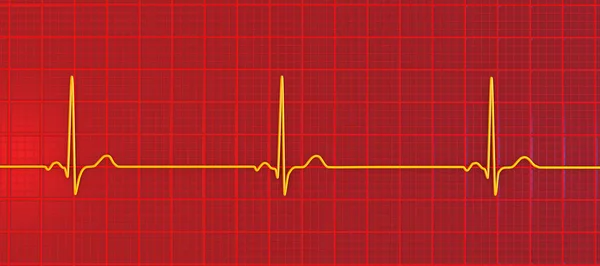
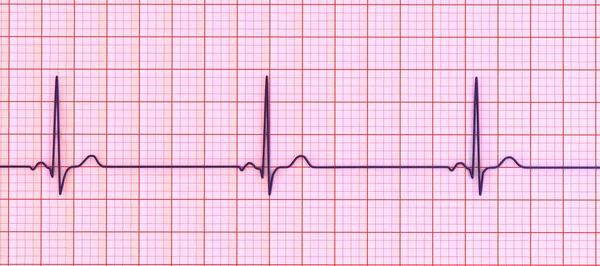
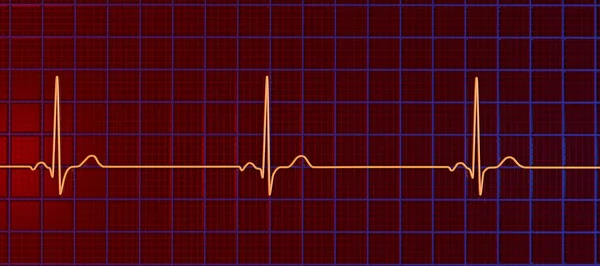
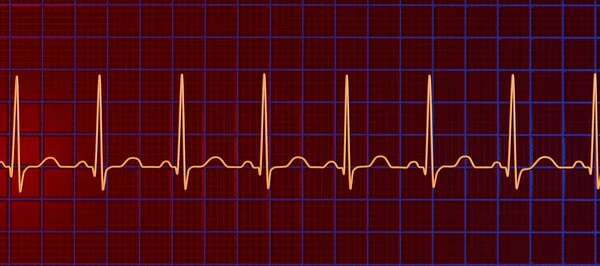
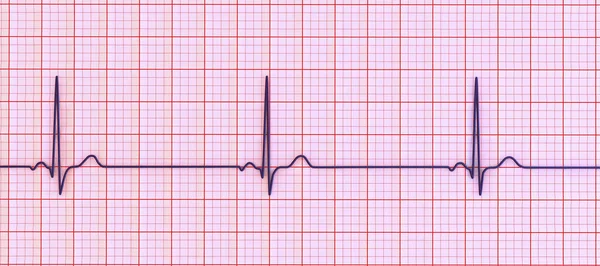
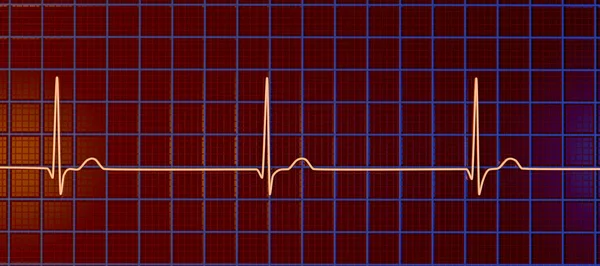
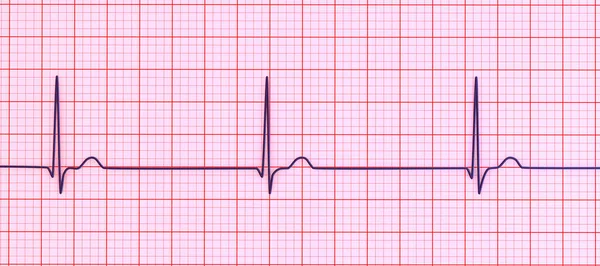
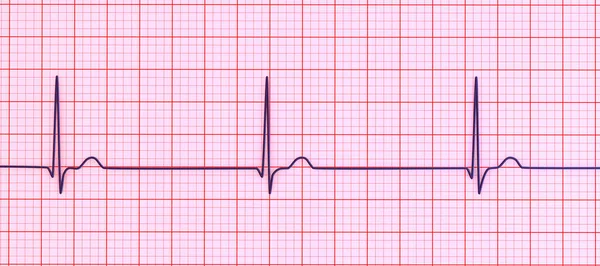
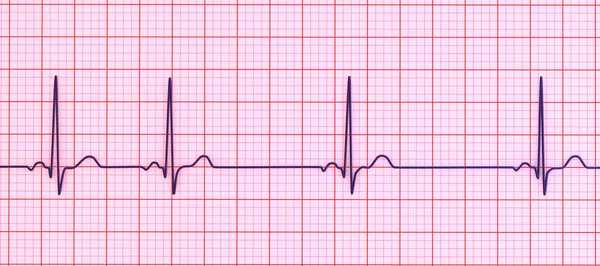
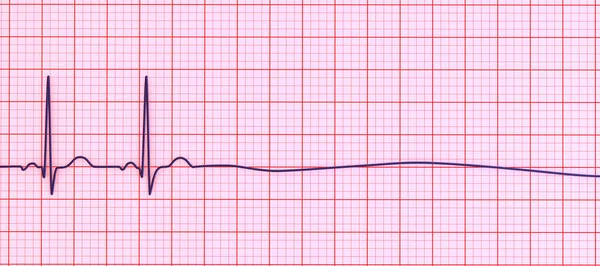
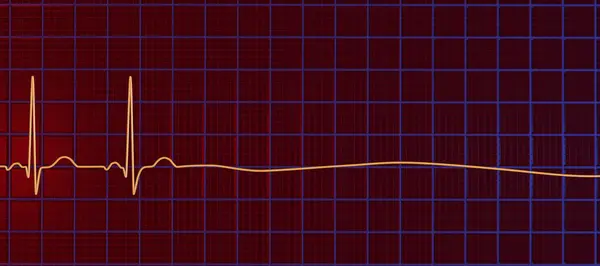
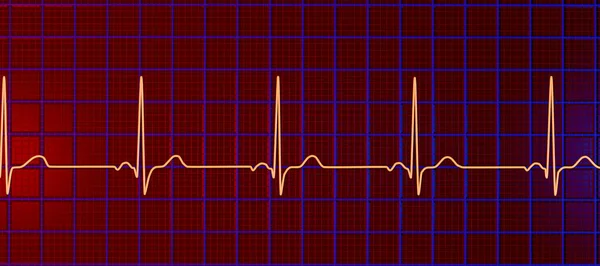
Illustration Visualizing Ecg 3Rd Degree Block Showing Complete Dissociation Atrial — Stock Photo, Image

3D illustration visualizing an ECG with 3rd degree AV block, showing complete dissociation between atrial and ventricular rhythms. — Photo

3D illustration visualizing an ECG with 3rd degree AV block, showing complete dissociation between atrial and ventricular rhythms.

 — Photo by katerynakon

Same Series:

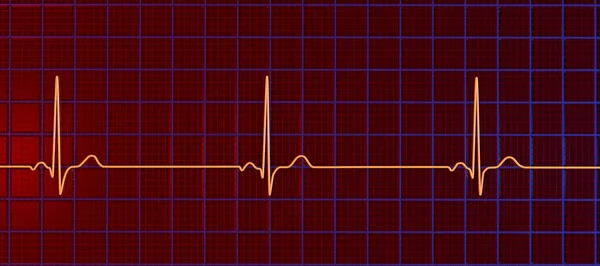
A detailed 3D illustration of an electrocardiogram displaying sinus bradycardia, a condition characterized by a slow heart rate originating from the sinus node, typically below 60 beats per minute.
Detailed Illustration Electrocardiogram Displaying Sinus Bradycardia Condition Characterized Slow Heart — Stock Photo, Image
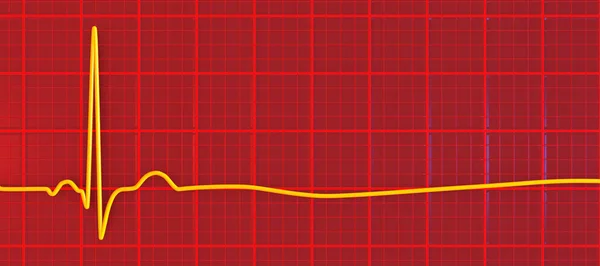
Asystole, a critical condition marked by the absence of any cardiac electrical activity. 3D illustration shows a flatline on the ECG, signifying a nonfunctioning heart with no pulse or heartbeat.
Asystole Critical Condition Marked Absence Any Cardiac Electrical Activity Illustration — Stock Photo, Image
A detailed 3D illustration of an electrocardiogram displaying sinus bradycardia, a condition characterized by a slow heart rate originating from the sinus node, typically below 60 beats per minute.
Detailed Illustration Electrocardiogram Displaying Sinus Bradycardia Condition Characterized Slow Heart — Stock Photo, Image
A detailed 3D illustration of an Electrocardiogram ECG displaying sinus tachycardia, a regular cardiac rhythm with heart rate that is higher than the upper limit of normal of 90-100 bpm in adults.
Detailed Illustration Electrocardiogram Ecg Displaying Sinus Tachycardia Regular Cardiac Rhythm — Stock Photo, Image
Electrocardiogram, ECG medical background, scienctific background 3D illustration
Electrocardiogram, ECG background — Stock Photo, Image
A detailed 3D illustration of an electrocardiogram displaying sinus bradycardia, a condition characterized by a slow heart rate originating from the sinus node, typically below 60 beats per minute.
Detailed Illustration Electrocardiogram Displaying Sinus Bradycardia Condition Characterized Slow Heart — Stock Photo, Image
Electrocardiogram ECG displaying a junctional rhythm, which occurs when the electrical signals in the heart originate from the atrioventricular junction instead of the sinoatrial node, 3D illustration
Electrocardiogram Ecg Displaying Junctional Rhythm Which Occurs Electrical Signals Heart — Stock Photo, Image
A detailed 3D illustration of an Electrocardiogram ECG displaying sinus arrhythmia, a condition characterized by irregular heart rhythms originating from the sinus node.
Detailed Illustration Electrocardiogram Ecg Displaying Sinus Arrhythmia Condition Characterized Irregular — Stock Photo, Image
Asystole, a critical condition marked by the absence of any cardiac electrical activity. 3D illustration shows a flatline on the ECG, signifying a nonfunctioning heart with no pulse or heartbeat.
Asystole Critical Condition Marked Absence Any Cardiac Electrical Activity Illustration — Stock Photo, Image
A normal electrocardiogram ECG, 3D illustration displaying the electrical activity of the heart in a healthy individual
Normal Electrocardiogram Ecg Illustration Displaying Electrical Activity Heart Healthy Individual — Stock Photo, Image

Usage Information

You can use this royalty-free photo "3D illustration visualizing an ECG with 3rd degree AV block, showing complete dissociation between atrial and ventricular rhythms." for personal and commercial purposes according to the Standard or Extended License. The Standard License covers most use cases, including advertising, UI designs, and product packaging, and allows up to 500,000 print copies. The Extended License permits all use cases under the Standard License with unlimited print rights and allows you to use the downloaded stock images for merchandise, product resale, or free distribution.

You can buy this stock photo and download it in high resolution up to 9000x4000. Upload Date: Mar 4, 2024