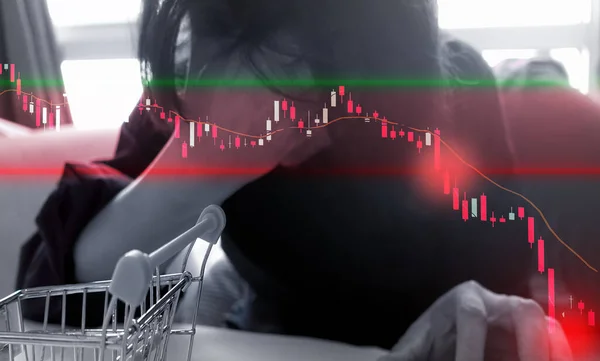
Stock Graph Chart Candlesticks Bearish Market Panic Selling Does Involve — Stock Photo, Image

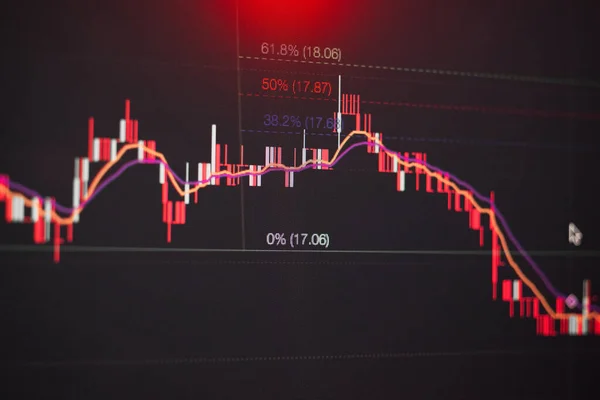
Stock graph chart candlesticks in bearish market, panic selling does not involve an evaluation of the fundamental of stock markets — Photo

Stock graph chart candlesticks in bearish market, panic selling does not involve an evaluation of the fundamental of stock markets

 — Photo by tanakorn.akk

Same Series:

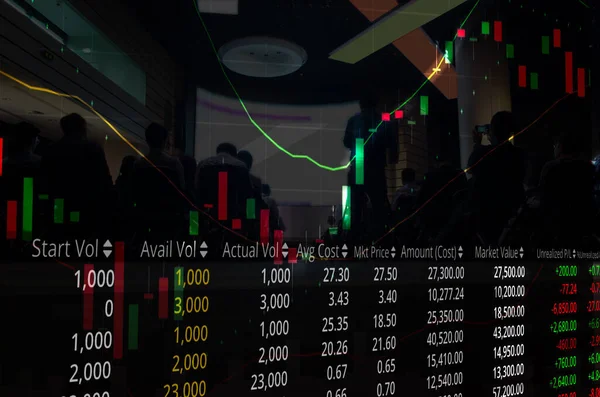
Double exporsure stock technical graph and blurred background of Business person or stock trader people are standing in the office
Double Exporsure Stock Technical Graph Blurred Background Business Person Stock — Stock Photo, Image
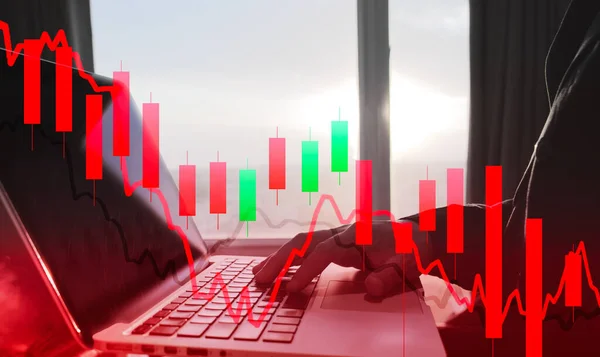
Stock price down in bearlish market concept, stock trader using laptop for trading, stock graph chart with fibonacci indicator, macd indicator in panic bearlish markets on red background
Stock Price Bearlish Market Concept Stock Trader Using Laptop Trading — Stock Photo, Image
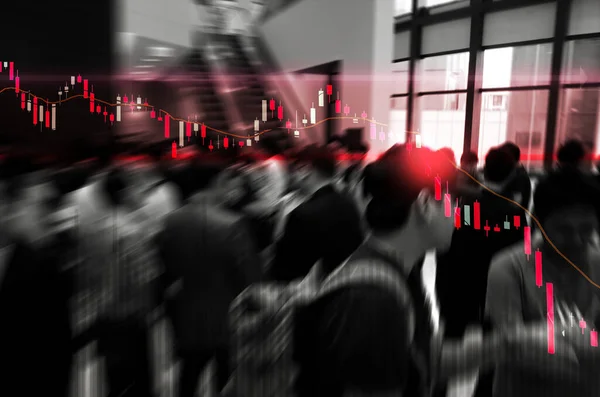
Stock technical chart in bearish market and candlestick price down with blurred business people on background, stock exchange panic sell concept
Stock Technical Chart Bearish Market Candlestick Price Blurred Business People — Stock Photo, Image
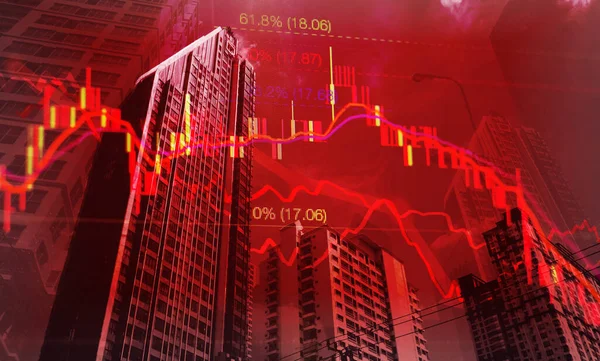
Stock graph candle stick price down in bear markets and volume diagram with skyscraper, stock exchange in bearish markets concept
Stock Graph Candle Stick Price Bear Markets Volume Diagram Skyscraper — Stock Photo, Image
Graph and stock exchange price with Business man or stock trader are analyzing the market data on monitor, stock analyzing concept
Graph Stock Exchange Price Business Man Stock Trader Analyzing Market — Stock Photo, Image
Stock graph chart with fibonacci indicator in bear markets, stock exchange in bear concept
Stock Graph Chart Fibonacci Indicator Bear Markets Stock Exchange Bear — Stock Photo, Image
Graph downturn concept, Blurred background of trader and stock graph chart in break out trend line, panic sell on bearlish market
Graph Downturn Concept Blurred Background Trader Stock Graph Chart Break — Stock Photo, Image
Stock graph chart candle stick with fibonacci and ema indicators on led monitor, stock graph in bearish markets concept
Stock Graph Chart Candle Stick Fibonacci Ema Indicators Led Monitor — Stock Photo, Image
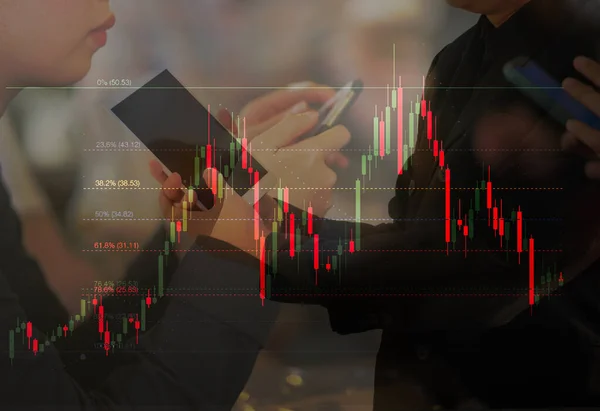
Business people analyzing graph chart concept, business person or stock traders are using smartphone for analyzing graph chart
Business People Analyzing Graph Chart Concept Business Person Stock Traders — Stock Photo, Image
Business financial graph, price down trend and cityscape view
Business Financial Graph Price Trend Cityscape View — Stock Photo, Image
Stock market graph in modern building city sky, dark color background, concept for stock trading and financial markets
Stock Market Graph Modern Building City Sky Dark Color Background — Stock Photo, Image
Double exposure stock graph indicator and skyscraper in green background, business or financial chart concept, copy space at left
Double Exposure Stock Graph Indicator Skyscraper Green Background Business Financial — Stock Photo, Image
Stock graph chart candlesticks with RSI and EMA Indicators and Stock Trader's leg are standing for analysis, stock markets graph analysis concept
Stock Graph Chart Candlesticks Rsi Ema Indicators Stock Trader Leg — Stock Photo, Image
Stock graph chart analysis with parabolic indicator and volume diagram with cityscape night view on background, stock chart analysis by indicators concept
Stock Graph Chart Analysis Parabolic Indicator Volume Diagram Cityscape Night — Stock Photo, Image
Stock graph candlestick price down concept, stock graph in bear market and cityscape view
Stock Graph Candlestick Price Concept Stock Graph Bear Market Cityscape — Stock Photo, Image
Trader shocking because stock market graph chart in panic selling on bearish market with EMA indicator, panic sell or stock bearish market concept
Trader Shocking Because Stock Market Graph Chart Panic Selling Bearish — Stock Photo, Image

Usage Information

You can use this royalty-free photo "Stock graph chart candlesticks in bearish market, panic selling does not involve an evaluation of the fundamental of stock markets" for personal and commercial purposes according to the Standard or Extended License. The Standard License covers most use cases, including advertising, UI designs, and product packaging, and allows up to 500,000 print copies. The Extended License permits all use cases under the Standard License with unlimited print rights and allows you to use the downloaded stock images for merchandise, product resale, or free distribution.

You can buy this stock photo and download it in high resolution up to 4928x3264. Upload Date: Aug 5, 2020