Charts and graphs Stock Photos

100,000 Charts and graphs pictures are available under a royalty-free license

  • Best Match
  • Fresh
  • Popular
1-100 of 100,000
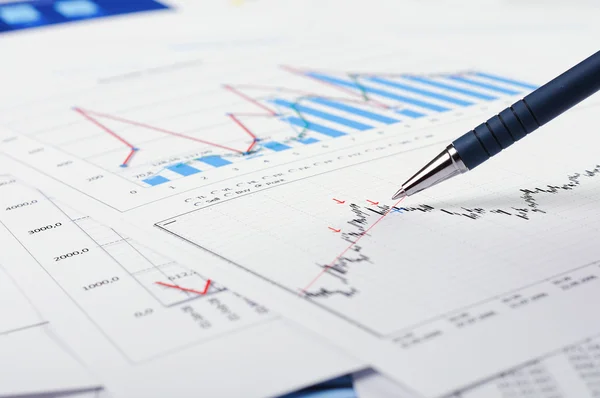
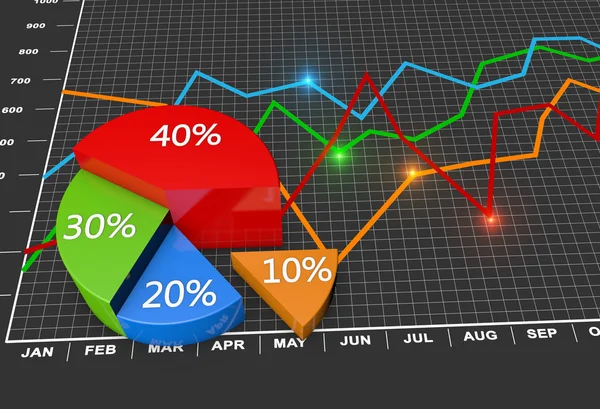
Financial charts and graphs
Financial charts and graphs — Stock Photo, Image
Businessman hand working with new modern computer
Businessman hand working with new modern computer — Stock Photo, Image
Charts and graphs of sales
Charts and graphs of sales — Stock Photo, Image
Digital statistics
Digital statistics — Stock Photo, Image
FInancial diagrams, charts and graphs
FInancial diagrams, charts and graphs — Stock Photo, Image
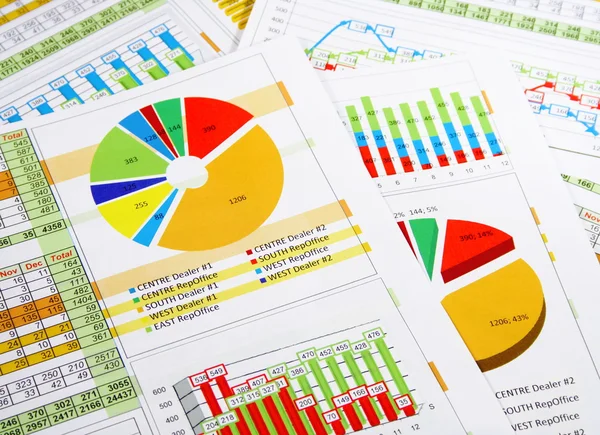
Annual Report in Graphs and Charts
Annual Report in Graphs and Charts — Stock Photo, Image
FInancial diagrams, charts and graphs
FInancial diagrams, charts and graphs — Stock Photo, Image
Digital sketch of the different financial charts, graphs and calculations. A concept of capital market transactions and forex trading.
Digital sketch of the different financial charts, graphs and calculations. A concept of capital market transactions and forex trading. — Stock Photo, Image
Business people discussing the charts and graphs
Business people discussing the charts and graphs — Stock Photo, Image
Hi-tech analysis
Hi-tech analysis — Stock Photo, Image
Elephant and Earth
Elephant and Earth — Stock Photo, Image
Elephant and earth
Elephant and earth — Stock Photo, Image
Elephant balancing on a world
Elephant balancing on a world — Stock Photo, Image
Financial business chart and graphs
Financial business chart and graphs — Stock Photo, Image
Premium infographics master collection:
Premium infographics master collection: — Stock Photo, Image
Global economy
Global economy — Stock Photo, Image
Futuristic user interface. Mixed media
Futuristic user interface. Mixed media — Stock Photo, Image
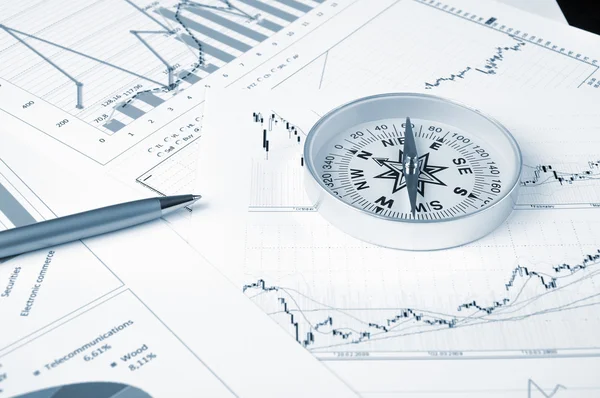
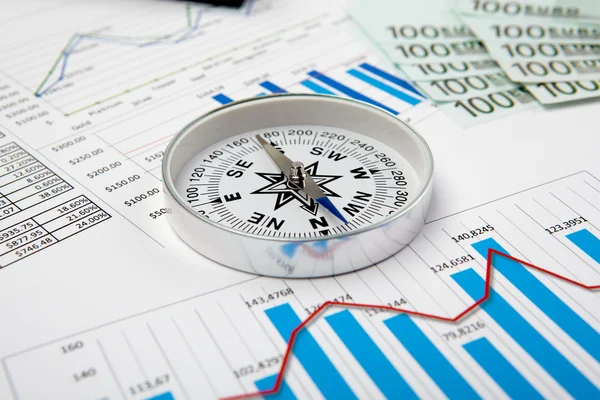
Graphs and charts with compass.
Graphs and charts with compass. — Stock Photo, Image
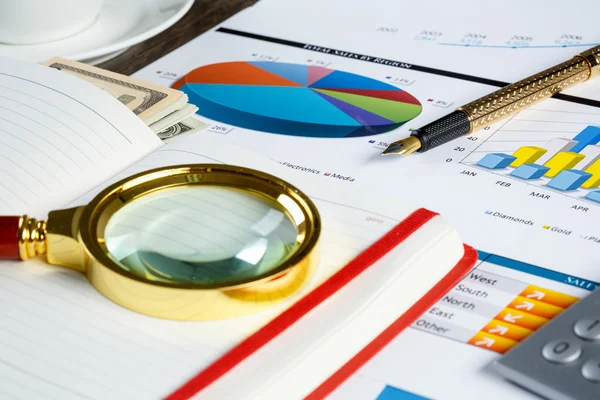
Financial charts and graphs on the table
Financial charts and graphs on the table — Stock Photo, Image
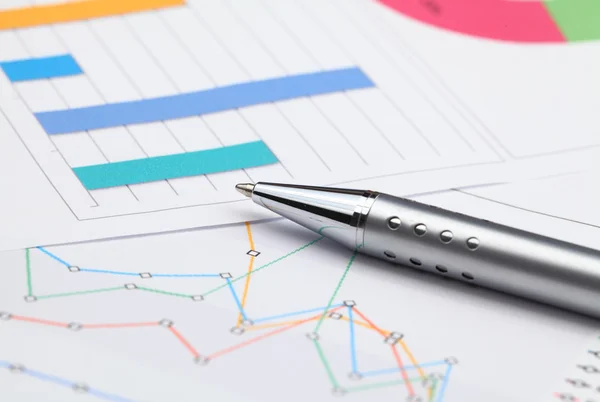
Graphs close-up
Graphs close-up — Stock Photo, Image
Charts and graphs of sales
Charts and graphs of sales — Stock Photo, Image
Businessman Working With Modern Devices
Businessman Working With Modern Devices — Stock Photo, Image
Financial charts and graphs
Financial charts and graphs — Stock Photo, Image
Financial charts and graphs on the table
Financial charts and graphs on the table — Stock Photo, Image
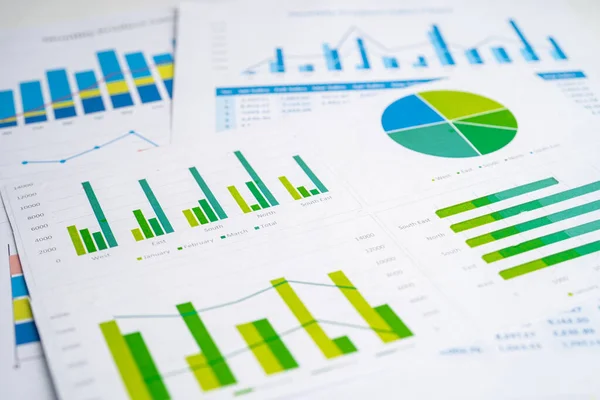
Charts Graphs spreadsheet paper. Financial development, Banking Account, Statistics, Investment Analytic research data economy, Stock exchange Business office company meeting concept.
Charts Graphs Spreadsheet Paper Financial Development Banking Account Statistics Investment — Stock Photo, Image
Many charts and graphs. Reflection light and flare.
Many charts and graphs. Reflection light and flare. — Stock Photo, Image
Cropped view of businessman pointing with pencil at document near partners on blurred foreground
Cropped View Businessman Pointing Pencil Document Partners Blurred Foreground — Stock Photo, Image
Salesman standing with drawn graph charts
Salesman standing with drawn graph charts — Stock Photo, Image
Charts Graphs paper. Financial development, Banking Account, Statistics, Investment Analytic research data economy, Stock exchange Business office company meeting concept.
Charts Graphs Paper Financial Development Banking Account Statistics Investment Analytic — Stock Photo, Image
Charts Graphs paper. Financial development, Banking Account, Statistics, Investment Analytic research data economy, Stock exchange Business office company meeting concept.
Charts Graphs Paper Financial Development Banking Account Statistics Investment Analytic — Stock Photo, Image
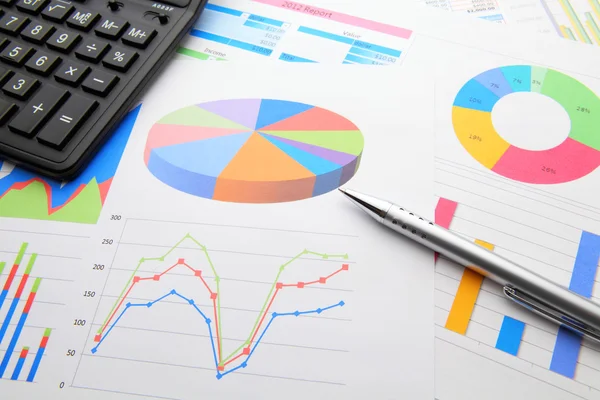
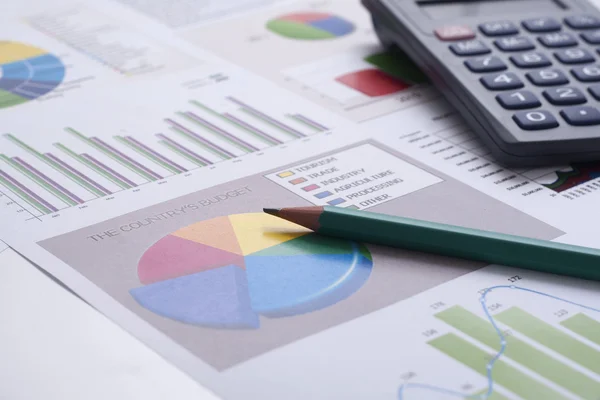
Data chart and calculator
Data chart and calculator — Stock Photo, Image
Top view of opened laptop with paper charts and graphs, pointers on white background
Top View Opened Laptop Paper Charts Graphs Pointers White Background — Stock Photo, Image
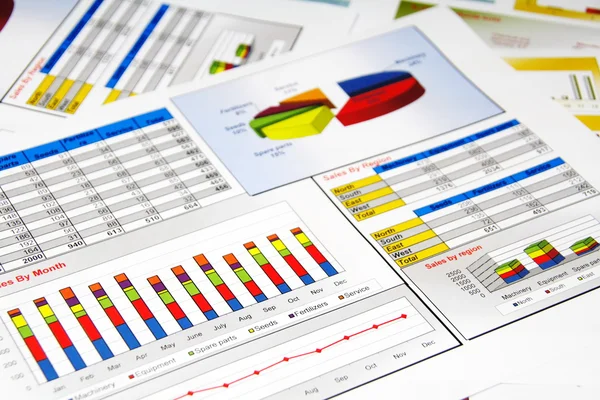
Sales Report in Statistics, Graphs and Charts
Sales Report in Statistics, Graphs and Charts — Stock Photo, Image
Business
Business — Stock Photo, Image
Financial graphs and charts on blurred business center background. Invesment and trading concept.
Financial Graphs Charts Blurred Business Center Background Invesment Trading Concept — Stock Photo, Image
Brainstorm team, Marketers and financial accountants are discussing and analyzing charts to plan strategies to meet customer needs, Using graphs and laptops to analyze business data, Meeting concept.
Brainstorm Team Marketers Financial Accountants Discussing Analyzing Charts Plan Strategies — Stock Photo, Image
People on the background of graphs and charts.
People on the background of graphs and charts. — Stock Photo, Image
Financial results
Financial results — Stock Photo, Image
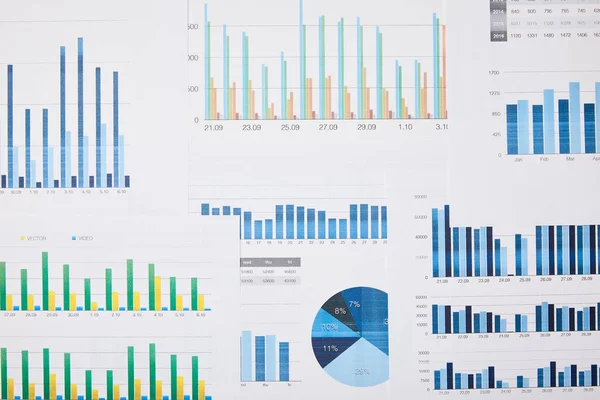
Blue charts, graphs, data and reports
Blue charts, graphs, data and reports — Stock Photo, Image
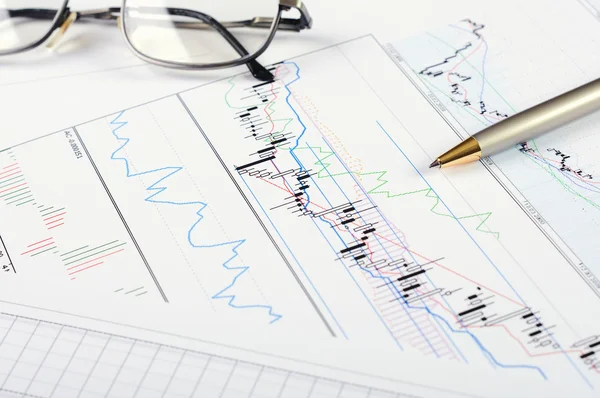
Graphical chart analysis
Graphical chart analysis — Stock Photo, Image
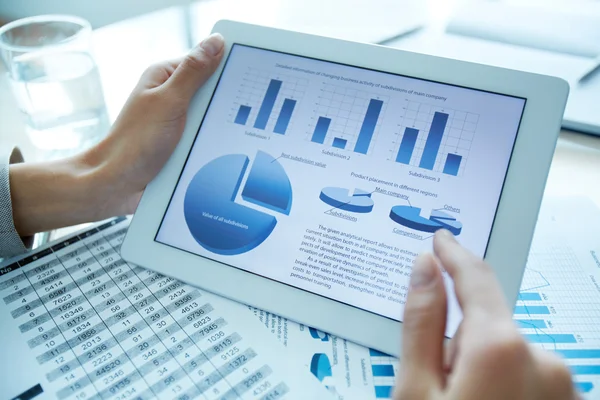
Digital tablet with business charts on a screen
Digital tablet with business charts on a screen — Stock Photo, Image
Top view of papers with charts and graphs on table
Top View Papers Charts Graphs Table — Stock Photo, Image
Laptop and computer with charts and graphs, documents on table
Laptop Computer Charts Graphs Documents Table — Stock Photo, Image
Analysis of business graphs
Analysis of business graphs — Stock Photo, Image
Businessman working on annual report
Businessman working on annual report — Stock Photo, Image
Statistics
Statistics — Stock Photo, Image
Stock market chart
Stock market chart — Stock Photo, Image
Business people working with graphs
Business people working with graphs — Stock Photo, Image
Businessman working with charts
Businessman working with charts — Stock Photo, Image
Charts and graphs
Charts and graphs — Stock Photo, Image
Financial business chart and graphs
Financial business chart and graphs — Stock Photo, Image
My Worktable
My Worktable — Stock Photo, Image
Person using devices
Person using devices — Stock Photo, Image
Financial graphs and charts on blurred business center background. Invesment and trading concept.
Financial Graphs Charts Blurred Business Center Background Invesment Trading Concept — Stock Photo, Image
Person using devices
Person using devices — Stock Photo, Image
Businessman plan graph growth and increase of chart positive indicators in his business
Businessman Plan Graph Growth Increase Chart Positive Indicators His Business — Stock Photo, Image
Business woman with colorful graphs and charts
Business woman with colorful graphs and charts — Stock Photo, Image
Superhero
Superhero — Stock Photo, Image
Superhero Businessman Transforming
Superhero Businessman Transforming — Stock Photo, Image
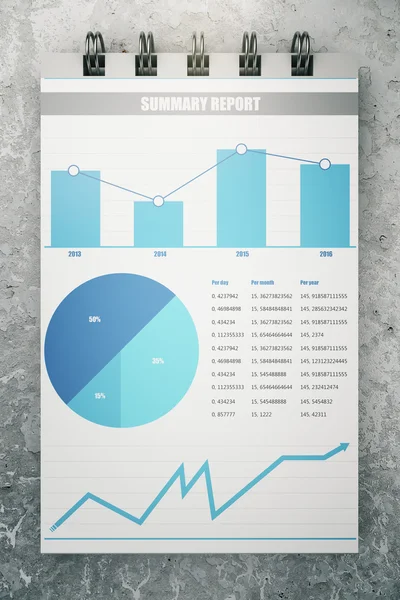
Business chart on notepad page on concrete floor top view
Business chart on notepad page on concrete floor top view — Stock Photo, Image
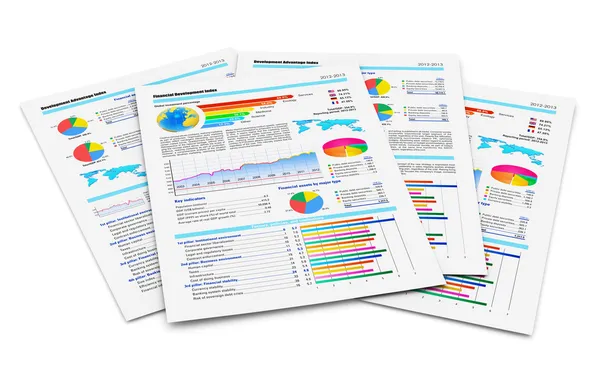
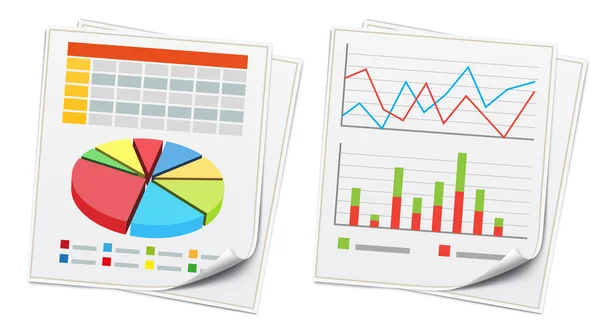
Financial reports
Financial reports — Stock Photo, Image
Impressive figures
Impressive figures — Stock Photo, Image
Examining graphs with other on background
Examining graphs with other on background — Stock Photo, Image
Modern people doing business, graphs and charts being demonstrated on the screen of a touch-pad
Modern people doing business, graphs and charts being demonstrated on the screen of a touch-pad — Stock Photo, Image
Financial graphs and charts
Financial graphs and charts — Stock Photo, Image
Stock exchange board, abstract background
Stock exchange board, abstract background — Stock Photo, Image
Database Table
Database Table — Stock Photo, Image
Financial business chart and graphs
Financial business chart and graphs — Stock Photo, Image
Financial printed paper charts, computer, graphs and diagrams
Financial printed paper charts, computer, graphs and diagrams — Stock Photo, Image
Business people and graphs
Business people and graphs — Stock Photo, Image
Man typing on keypad
Man typing on keypad — Stock Photo, Image
Businessman analyzing graphs
Businessman analyzing graphs — Stock Photo, Image
Close up of hands drawing charts on paper sheets
Close up of hands drawing charts on paper sheets — Stock Photo, Image
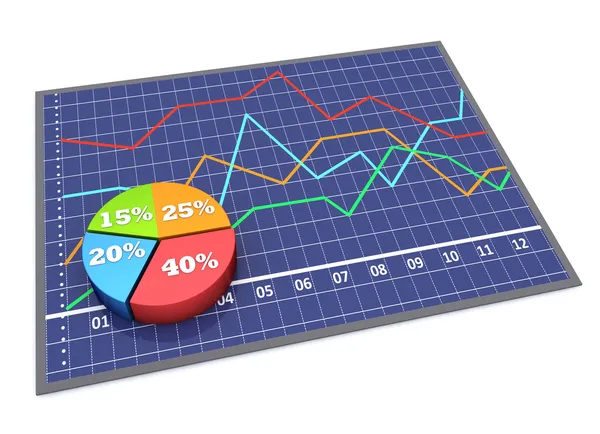
3d pie chart on graph paper
3d pie chart on graph paper — Stock Photo, Image
Graphs, charts, infographics.
Graphs, charts, infographics. — Stock Photo, Image
Financial graphics diagram for work business
Financial graphics diagram for work business — Stock Photo, Image
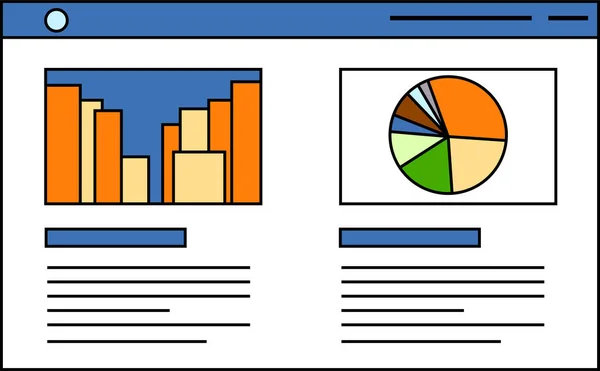
This is a illustration of Website screen view
Illustration Website Screen View — Stock Photo, Image
Touchpad or touchscreen flat device from above analysing data
Touchpad or touchscreen flat device from above analysing data — Stock Photo, Image
Business concept
Business concept — Stock Photo, Image
Graphs and charts
Graphs and charts — Stock Photo, Image
Business Growth Chart
Business Growth Chart — Stock Photo, Image
Business Graph
Business Graph — Stock Photo, Image
Business stock market, trading, info graphic with animated graphs, charts and data numbers insight analysis to be shown on monitor display screen for business meeting mock up theme
Business Stock Market Trading Info Graphic Animated Graphs Charts Data — Stock Photo, Image
Business growth graphs
Business growth graphs — Stock Photo, Image
Business Charts
Business Charts — Stock Photo, Image
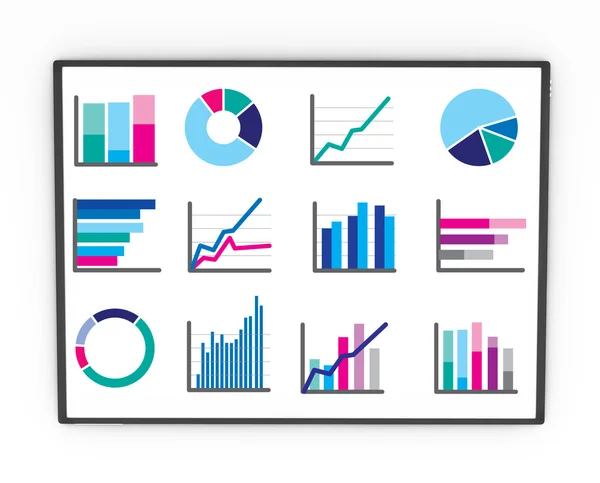
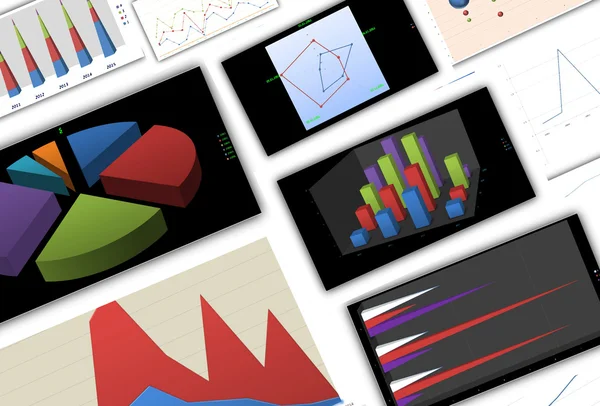
Wide selection of styles of bar and pie graphs
Wide selection of styles of bar and pie graphs — Stock Photo, Image
Business charts and infographics - 3d rendering
Business charts and infographics - 3d rendering — Stock Photo, Image
Set of graphs, diagrams and statistics icons. Premium quality symbol collection. Icons can be used for web, app and UI design.
Set of graphs, diagrams and statistics icons. Premium quality symbol collection. Icons can be used for web, app and UI design. — Stock Photo, Image
Table indexes exempted (gray)
Table Indexes Exempted Gray — Stock Photo, Image
Financial and business chart and graphs
Financial and business chart and graphs — Stock Photo, Image
Business Financial Decline Analytic Graph
Business Financial Decline Analytic Graph — Stock Photo, Image
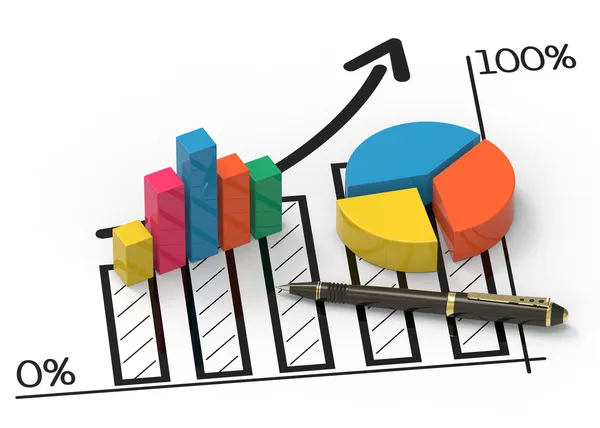
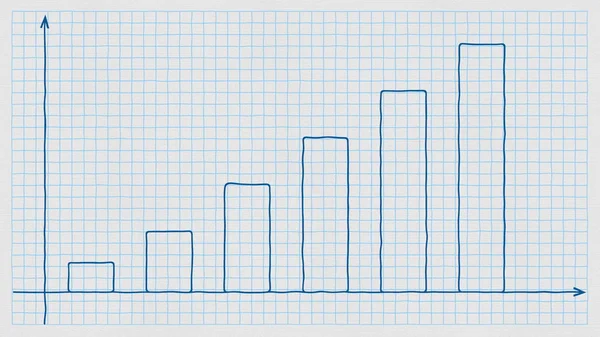
Handwritten rising bar chart on checkered paper. Conceptual illustration
Handwritten rising bar chart on checkered paper. Conceptual illustration — Stock Photo, Image
Pad with business chart
Pad with business chart — Stock Photo, Image
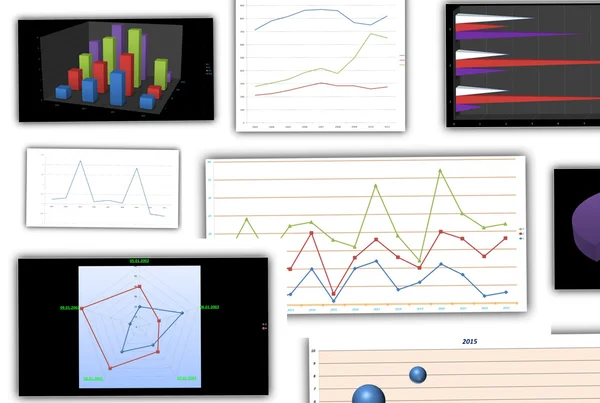
Set of different charts on squared paper
Set Different Charts Squared Paper — Stock Photo, Image
Business Growth Silver Bars isolated on white background High resolution 3D image
Business Growth Silver Bars isolated on white background High resolution 3D image — Stock Photo, Image
Graphs and charts
Graphs and charts — Stock Photo, Image
Graphs and charts
Graphs and charts — Stock Photo, Image
Office desk table with business paper.
Office desk table with business paper. — Stock Photo, Image
Digitally generated Business interface with graphs and data
Digitally Generated Business Interface Graphs Data — Stock Photo, Image
Illustration Elements of infographic for business
Illustration Elements Infographic Business — Stock Photo, Image

Related image searches

Find the Perfect Charts and Graphs Images for your Projects

When it comes to visualizing data and conveying information effectively, charts and graphs are your best allies. These powerful tools can simplify complex data, making it easier to understand and analyze. At Stock Images, we offer a wide variety of high-quality charts and graphs images that will elevate your presentations, reports, and websites to a whole new level.

1. Unleash the Power of Visual Storytelling

Charts and graphs are not just mere illustrations; they tell a story. They help you communicate your data in a way that is impactful and memorable. Our stock library provides a plethora of charts and graphs images, ranging from bar charts and pie charts to line graphs and scatter plots. Whether you need to showcase sales figures, compare market trends, or present survey results, our images will grab attention and leave a lasting impression.

2. Versatile Image Formats to Suit Your Needs

We understand that different projects require different image formats. That's why our charts and graphs images are available in a variety of file types, including JPG, AI, and EPS. Whether you need a high-resolution image for print materials or a scalable vector file for web design, we've got you covered. Please note that SVG format is not available at the moment, but our AI and EPS files can provide you with the flexibility you need.

3. Enhance Presentations, Reports, and Websites

Charts and graphs images can take your presentations, reports, and websites from ordinary to extraordinary. By incorporating visual elements into your content, you can captivate your audience and make your message more impactful. Whether you're delivering a keynote, compiling a business report, or designing a website, our charts and graphs images will add the perfect touch of professionalism and visual appeal.

4. Practical Tips for Using Charts and Graphs Images

While charts and graphs are undoubtedly powerful tools, it's essential to use them correctly to maximize their impact:

Choose the Right Type: Different types of charts and graphs are suitable for different types of data. Consider your data and the message you want to convey, and select the appropriate chart or graph accordingly. Bar charts are ideal for comparing categories, line graphs are great for showing trends over time, and pie charts are perfect for illustrating proportions.

Keep it Simple: Avoid cluttering your visuals with excessive data points or unnecessary decorations. Keep your charts and graphs clean and concise, so that the main message stands out. Use colors strategically to highlight important data points and ensure readability.

Provide Context: Always provide clear labels, titles, and legends to help your audience understand the data being presented. Contextualize your charts and graphs by including units of measurement or time periods. This will ensure that your audience interprets the information correctly and can make informed decisions.

Update Regularly: If your charts and graphs display data that changes over time, make sure to update them regularly. Stale or outdated visualizations can lead to incorrect conclusions or misinformed decisions. Keep your visuals up to date to maintain their relevance and accuracy.

At Stock Images, we understand the importance of selecting the right visual elements to enhance your projects. With our extensive collection of charts and graphs images, you can harness the power of visual storytelling and create impactful presentations, reports, and websites. Choose from a range of versatile image formats, and follow our practical tips to use charts and graphs effectively. Take your projects to new heights with our professional visuals.