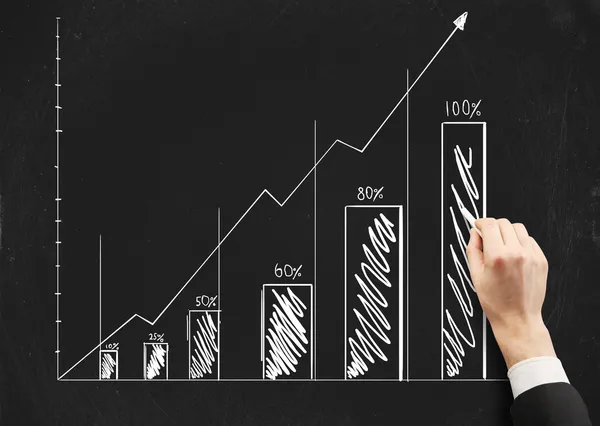
Measure success
Measure success — Stock Photo, Image
Businessman hand use smart phone computer with email icon as con
Businessman hand use smart phone computer with email icon as con — Stock Photo, Image
Key Performance Indicator (KPI) workinng with Business Intelligence (BI) metrics to measure achievement and planned target.businessman using digital tablet and laptop computer and document in modern office
Key Performance Indicator Kpi Workinng Business Intelligence Metrics Measure Achievement — Stock Photo, Image
Hand holding speech bubble with a bar graph growing up. Metrics, measures, analytics concept.
Hand holding speech bubble with a bar graph growing up. Metrics, measures, analytics concept. — Stock Photo, Image
Business graph
Business graph — Stock Photo, Image
Business graph
Business graph — Stock Photo, Image
Businesswoman analyzing financial data
Businesswoman analyzing financial data — Stock Photo, Image
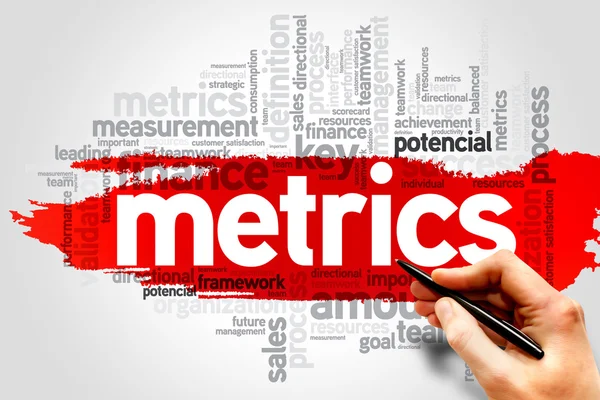
Metrics
Metrics — Stock Photo, Image
Hand with marker writing text
Hand with marker writing text — Stock Photo, Image
Business Analytics
Business Analytics — Stock Photo, Image
Business Analysis
Business Analysis — Stock Photo, Image
Modern business planning
Modern business planning — Stock Photo, Image
Showing your profile data on bar graph
Showing your profile data on bar graph — Stock Photo, Image
Investor analyzing stock market report and financial dashboard with business intelligence (BI), with key performance indicators (KPI).Businessman using smart phone with laptop computer.
Investor Analyzing Stock Market Report Financial Dashboard Business Intelligence Key — Stock Photo, Image
Top view of metrics lettering made of wooden cubes on blue background
Top View Metrics Lettering Made Wooden Cubes Blue Background — Stock Photo, Image
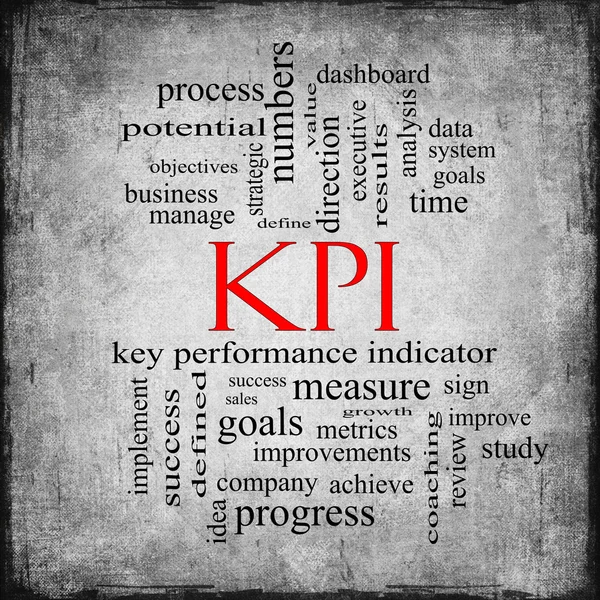
KPI Word Cloud Gray Grunge Concept
KPI Word Cloud Gray Grunge Concept — Stock Photo, Image
Business Analysis
Business Analysis — Stock Photo, Image
Investor analyzing stock market report and financial dashboard with business intelligence (BI), with key performance indicators (KPI).businessman hand working with finances program on wide screen computer.
Investor Analyzing Stock Market Report Financial Dashboard Business Intelligence Key — Stock Photo, Image
Key Performance Indicator (KPI) workinng with Business Intelligence (BI) metrics to measure achievement and planned target.
Key Performance Indicator Kpi Workinng Business Intelligence Metrics Measure Achievement — Stock Photo, Image
Businessman working with smart phone and digital tablet and lapt
Businessman working with smart phone and digital tablet and lapt — Stock Photo, Image
Business intelligence BI Key performance indicator KPI Analysis dashboard transparent blurred background
Business intelligence BI Key performance indicator KPI Analysis dashboard transparent blurred background — Stock Photo, Image
Key Performance Indicator (KPI) workinng with Business Intelligence (BI) metrics to measure achievement and planned target.businessman working with smart phone and laptop computer on wooden desk.
Key Performance Indicator Kpi Workinng Business Intelligence Metrics Measure Achievement — Stock Photo, Image
Businessman working with smart phone and digital tablet and lapt
Businessman working with smart phone and digital tablet and lapt — Stock Photo, Image
Metrics
Metrics — Stock Photo, Image
Business graph
Business graph — Stock Photo, Image
Business intelligence BI Key performance indicator KPI Analysis dashboard transparent blurred background.
Business intelligence BI Key performance indicator KPI Analysis dashboard transparent blurred background. — Stock Photo, Image
Yellow Tape metrics
Yellow Tape metrics — Stock Photo, Image
Analytics and related words in a collage background
Analytics and related words in a collage background — Stock Photo, Image
Metrics word on a wooden ruler
Metrics word on a wooden ruler — Stock Photo, Image
Metrics text concept
Metrics text concept — Stock Photo, Image
KIP, Surpass Sales Targets
KIP, Surpass Sales Targets — Stock Photo, Image
Business Analysis
Business Analysis — Stock Photo, Image
Online Marketing
Online Marketing — Stock Photo, Image
KPI - Key Performance Indicator
KPI - Key Performance Indicator — Stock Photo, Image
Concept with CONSIDER word
Concept with CONSIDER word — Stock Photo, Image
Online Marketing
Online Marketing — Stock Photo, Image
Businessmen with a tape measure
Businessmen  with a tape measure — Stock Photo, Image
Key Performance Indicator (KPI) workinng with Business Intelligence (BI) metrics to measure achievement and planned target.businessman working with smart phone and digital tablet and laptop computer.
Key Performance Indicator Kpi Workinng Business Intelligence Metrics Measure Achievement — Stock Photo, Image
Data Management System (DMS) with Business Analytics concept. businessman working with provide information for Key Performance Indicators (KPI) and marketing analysis onn virtual computer
Data Management System Dms Business Analytics Concept Businessman Working Provide — Stock Photo, Image
Man touching a financial analysis concept on a touch screen with his finger
Man Touching Financial Analysis Concept Touch Screen His Finger — Stock Photo, Image
Investor analyzing stock market report and financial dashboard with business intelligence (BI), with key performance indicators (KPI).businessman hand working with finances about cost and calculator.
Investor Analyzing Stock Market Report Financial Dashboard Business Intelligence Key — Stock Photo, Image
Metrics word on a wooden ruler
Metrics word on a wooden ruler — Stock Photo, Image
KPI - Key performance indicator. Business and industrial analysis. Internet and technology concept on virtual screen.
KPI - Key performance indicator. Business and industrial analysis. Internet and technology concept on virtual screen. — Stock Photo, Image
Business Analysis
Business Analysis — Stock Photo, Image
Data Management System (DMS) with Business Analytics concept. businessman working with provide information for Key Performance Indicators (KPI) and marketing analysis onn virtual computer
Data Management System Dms Business Analytics Concept Businessman Working Provide — Stock Photo, Image
KPI - Key Performance Indicator. Business and technology concept. Multiple exposure, mixed media. Financial concept on blurred background.
KPI - Key Performance Indicator. Business and technology concept. Multiple exposure, mixed media. Financial concept on blurred background. — Stock Photo, Image
Co working team meeting concept,businessman using smart phone an
Co working team meeting concept,businessman using smart phone an — Stock Photo, Image
Measure performance concept
Measure performance concept — Stock Photo, Image
Businesspeople working together
Businesspeople working together — Stock Photo, Image
Business people on meeting.
Business people on meeting. — Stock Photo, Image
Investor analyzing stock market report and financial dashboard with business intelligence (BI), with key performance indicators (KPI).businessman hand working with finances about cost and calculator.
Investor Analyzing Stock Market Report Financial Dashboard Business Intelligence Key — Stock Photo, Image
Time to Measure Words Clock Gauge Performance Level
Time to Measure Words Clock Gauge Performance Level — Stock Photo, Image
Customer Satisfaction
Customer Satisfaction — Stock Photo, Image
Customer Satisfaction - hand pressing button on interface with blue background.
Customer Satisfaction - hand pressing button on interface with blue background. — Stock Photo, Image
3d men holding customer service
3d men holding customer service — Stock Photo, Image
Company Metrics, Measuring Customer Satisfaction
Company Metrics, Measuring Customer Satisfaction — Stock Photo, Image
Connectivity Speedometer Connection Speed
Connectivity Speedometer Connection Speed — Stock Photo, Image
Blackboard Performance Metrics
Blackboard Performance Metrics — Stock Photo, Image
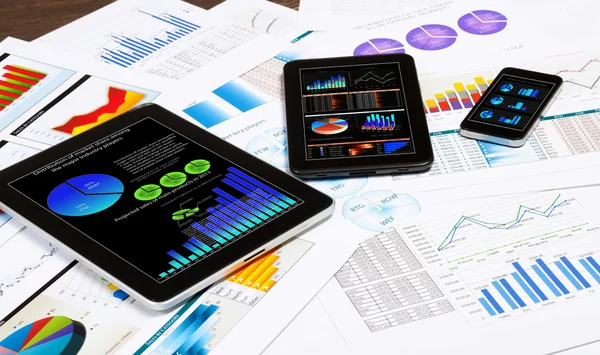
Set of computer devices
Set of computer devices — Stock Photo, Image
BENCHMARKING word concept on desk background
BENCHMARKING word concept on desk background — Stock Photo, Image
Concept with CONSIDER word
Concept with CONSIDER word — Stock Photo, Image
Performance Ruler Measurement Results
Performance Ruler Measurement Results — Stock Photo, Image
Business Acronym OPGM as Objectives Plans Goals Metrics
Business Acronym OPGM as Objectives Plans Goals Metrics — Stock Photo, Image
Man working on laptop
Man working on laptop — Stock Photo, Image
Market analysis
Market analysis — Stock Photo, Image
Wooden planks with business documents
Wooden planks with business documents — Stock Photo, Image
Businessman using laptop
Businessman using laptop — Stock Photo, Image
Investor analyzing stock market report and financial dashboard with business intelligence (BI), with key performance indicators (KPI).Businessman using smart phone with laptop computer.
Investor Analyzing Stock Market Report Financial Dashboard Business Intelligence Key — Stock Photo, Image
Personal data worth concept on blue background
Personal data worth concept on blue background — Stock Photo, Image
METRICS word written on wood block. METRICS text on wooden table for your desing, concept.
Metrics Word Written Wood Block Metrics Text Wooden Table Your — Stock Photo, Image
Businesswoman working with media interface
Businesswoman working with media interface — Stock Photo, Image
Teamwork and discussion; multiple exposure
Teamwork and discussion; multiple exposure — Stock Photo, Image
Hand drawing creative cogwheel business sketch. Teamwork, technology and leadership concept
Hand Drawing Creative Cogwheel Business Sketch Teamwork Technology Leadership Concept — Stock Photo, Image
Investor analyzing stock market report and financial dashboard with business intelligence (BI), with key performance indicators (KPI).cyber security internet and networking concept.Businessman hand working with VR.
Investor Analyzing Stock Market Report Financial Dashboard Business Intelligence Key — Stock Photo, Image
Metrics word cloud
Metrics word cloud — Stock Photo, Image
People hands using digital devices
People hands using digital devices — Stock Photo, Image
Project team discussing the outcomes of the pilot project
Project team discussing the outcomes of the pilot project — Stock Photo, Image
Unknown business woman with folder, isolated on white background
Unknown business woman with folder, isolated on white background — Stock Photo, Image
Digital Solutions
Digital Solutions — Stock Photo, Image
Ruler - To Measure is to Know - Importance of Metrics
Ruler - To Measure is to Know - Importance of Metrics — Stock Photo, Image
Media worldwide technology concept . Mixed media
Media worldwide technology concept . Mixed media — Stock Photo, Image
Business man pointing the text
Business man pointing the text — Stock Photo, Image
New york, USA - November 24, 2020: Google analytic acquisition overview on laptop screen
New York Usa November 2020 Google Analytic Acquisition Overview Laptop — Stock Photo, Image
Website Tracking
Website Tracking — Stock Photo, Image
Technology Development Concept
Technology Development Concept — Stock Photo, Image
Web Marketing management and reports background concept. Close-up rear view of a person holding and looking at smartphone and looking with Marketing reports on the mobile phone and laptop screen.
Web Marketing Management Reports Background Concept Close Rear View Person — Stock Photo, Image
Fund management concept
Fund management concept — Stock Photo, Image
Financial dashboard with business intelligence BI. Blurred megapolis.
Financial dashboard with business intelligence BI. Blurred megapolis. — Stock Photo, Image
Gaining Market Share
Gaining Market Share — Stock Photo, Image
3D illustration of an user experience gauge with the needle pointing excellent UX. Marketing concept
Illustration User Experience Gauge Needle Pointing Excellent Marketing Concept — Stock Photo, Image
Wooden Ruler to Measure an Object in Experiment or Research
Wooden Ruler to Measure an Object in Experiment or Research — Stock Photo, Image
Business team working at office
Business team working at office — Stock Photo, Image
Business process automation concept. Gears and icons on abstract background.
Business Process Automation Concept Gears Icons Abstract Background — Stock Photo, Image
Business process automation concept. Gears and icons on abstract background.
Business Process Automation Concept Gears Icons Abstract Background — Stock Photo, Image
Business process abstract diagram with gears and icons. Workflow and automation technology concept
Business process abstract diagram with gears and icons. Workflow and automation technology concept — Stock Photo, Image
KPI - Key performance indicator. Business and industrial analysis. Internet and technology concept on virtual screen.
KPI - Key performance indicator. Business and industrial analysis. Internet and technology concept on virtual screen. — Stock Photo, Image
Businessman success working with tablet computer
Businessman success working with tablet computer — Stock Photo, Image
Co working team meeting concept,businessman using smart phone an
Co working team meeting concept,businessman using smart phone an — Stock Photo, Image
Business process automation concept. Gears and icons on abstract background.
Business process automation concept. Gears and icons on abstract background. — Stock Photo, Image
Investor analyzing stock market report and financial dashboard with business intelligence (BI), with key performance indicators (KPI).businessman wearing virtual reality goggles in modern office.
Investor Analyzing Stock Market Report Financial Dashboard Business Intelligence Key — Stock Photo, Image

Related image searches

Metrics Images: Finding the Right Visuals for Your Data-driven Projects

Visuals are a necessary addition to any data-driven project, and metrics images provide a great deal of insight into the numbers behind them. With a wide range of stock images available in various formats like JPG, AI, and EPS, you can quickly and easily communicate your data story in a way that is both visually appealing and informative. In this article, we'll take a look at the available metrics images and how you can use them to enhance your next project.

Types of Metrics Images

Metrics images encompass a wide range of visuals that can be used to convey different kinds of data points. From charts and graphs to tables and heatmaps, there are many options available to choose from. Each image type is tailored to different kinds of data points, and selecting the right one can help you make a more meaningful and impactful statement.

When used correctly, pie charts provide a clear visual of the distribution of data, while bar graphs can be used to illustrate changes over time. On the other hand, scatter plots work well when there is a need for correlation data representation. Table metrics are best suited for comparing data points and presenting data in an easily digestible format. Heatmaps, on the other hand, are great for highlighting trends visually over a large data set.

How to Use Metrics Images Efficiently

Metrics images can be used in a variety of settings, from presentations to marketing campaigns, and online publications. They are essential for any data-driven project, but it's important to choose the right ones to capture your audience's attention. When using metrics images, make sure they are relevant to the data set you are working with. It's essential to keep it simple and avoid clutter or too many visuals. Overuse of metrics images can create confusion and reduce the overall effectiveness of your message.

When using metrics images, it's crucial to consider the goal of your project and select visuals that convey your message succinctly. Aim for clarity and simplicity, communicate the intended meaning of your message, and avoid the use of any unnecessary visual aids.

Metrics Images: Best Practices for Selection

When selecting a metrics image, consider the design of the visual and quality of the image. Ensure the quality of the visual is high enough to display on any device without distortion, while also paying attention to the design elements that are essential to the message conveyed.

It's also important to have a consistent visual theme throughout the project to generate coherence, ensure the visuals are consistent and the best format is used to convey your data.

It might also be a good investment to purchase an appropriate license to avoid copyright infringement issues. Carefully read the licensing or image usage agreement to avoid any legal troubles.

Where to Find Metrics Images

Whether you need a suitable visual for a business presentation or a chart for a publication, there are plenty of resources for finding quality metrics images. An easy and popular option is to use stock-photo websites like Shutterstock, Adobe Stock, and iStockPhoto. On these websites, you can browse thousands of high-quality images from popular image providers.

It's also meaningful to consider custom-made imagery that is tailored specifically to your data. This can result in a distinctive, eye-catching image that is precise and relevant to your message. When engaging a graphic designer or photographer to create custom visuals, it's essential to provide a comprehensive brief detailing your requirements.

Conclusion

In summary, metrics images are a powerful tool for storytelling. When used effectively, they can enhance your data message and create a more engaging and intellectually appealing presentation. Understanding what image type to use based on your data type is crucial for selecting impactful visuals. When choosing metrics images, keep your message clear and concise, avoid clutter, ensure consistency in design and quality, and purchase a license to avoid any legal troubles. With these tips in mind, you'll be on your way to creating impressive and memorable visuals for your next project.