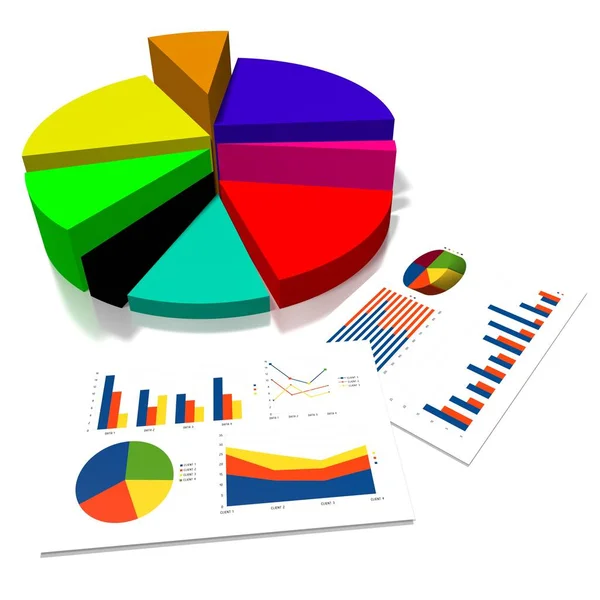
Pie Charts and other infographics drawings
Pie Charts and other infographics drawings — Stock Photo, Image
Business Graph with orange arrow
Business Graph with orange arrow — Stock Photo, Image
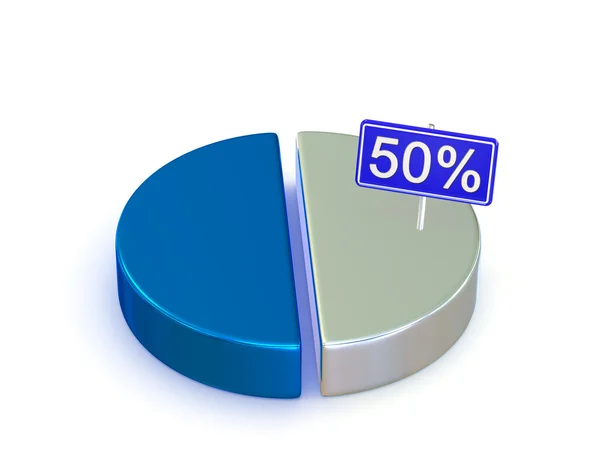
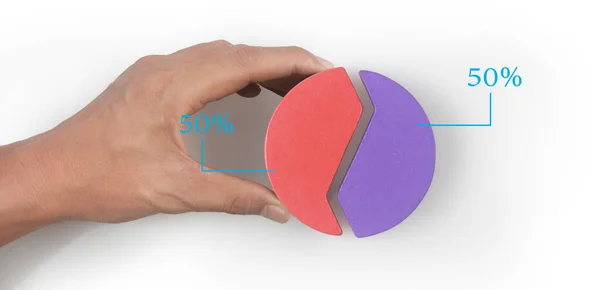
3d render of half pie graph that separate 50 percent part. Minimal pastel scene. Growth financial model.
Render Half Pie Graph Separate Percent Part Minimal Pastel Scene — Stock Photo, Image
Pie chart
Pie chart — Stock Photo, Image
Diagram
Diagram — Stock Photo, Image
3D render chart percentage proportion icon minimal cartoon Data analytics Optimization growth statistics finance graph business development concept. on blue background. illustration
Render Chart Percentage Proportion Icon Minimal Cartoon Data Analytics Optimization — Stock Photo, Image
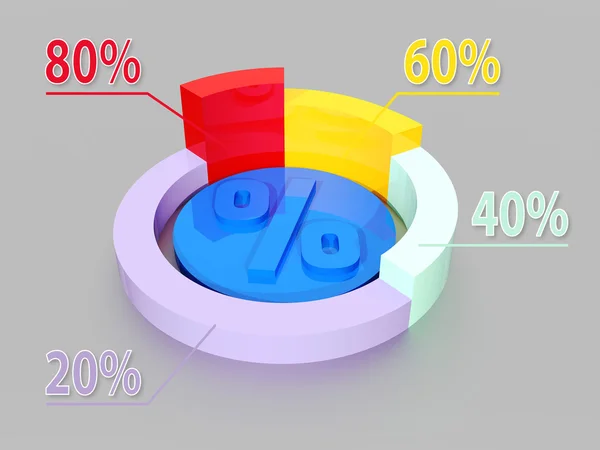
Pie chart with percent symbols isolated on orange background. 3d illustration
Pie Chart Percent Symbols Isolated Orange Background Illustration — Stock Photo, Image
Abstract business pie chart made concrete
Abstract Business Pie Chart Made Concrete — Stock Photo, Image
Percent symbols isolated on black
Percent symbols isolated on black — Stock Photo, Image
Histogram, metrics report or growth graph. 3d render illustration.
Histogram Metrics Report Growth Graph Render Illustration — Stock Photo, Image
Abstract business pie chart made concrete
Abstract Business Pie Chart Made Concrete — Stock Photo, Image
Color pie diagram 3D graphic shape up improvement marketing steps
Color Pie Diagram Graphic Shape Improvement Marketing Steps — Stock Photo, Image
Pie chart in white background
Pie Chart White Background — Stock Photo, Image
Pie Chart Shows Statistical Graphs And Graphics
Pie Chart Shows Statistical Graphs And Graphics — Stock Photo, Image
3d pie chart with percentages
3d pie chart with percentages — Stock Photo, Image
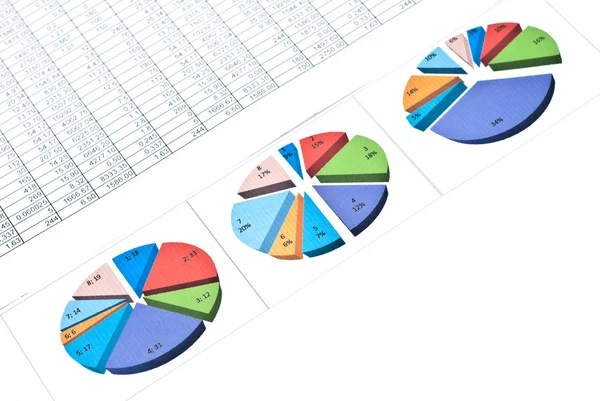
3d Business charts, Diagrams. business plan for the year.
3d Business charts, Diagrams. business plan for the year. — Stock Photo, Image
Chart pie with 0 5 10 15 20 25 30 35 40 45 50 55 60 65 70 75 80 85 90 95 100 percent. Percentage circle graph.
Chart pie with 0 5 10 15 20 25 30 35 40 45 50 55 60 65 70 75 80 85 90 95 100 percent. Percentage circle graph. — Stock Photo, Image
Business chart.
Business chart. — Stock Photo, Image
3d pie chart model
3d pie chart model — Stock Photo, Image
Pie circle chart. 12 section. circle graph for infographic.
Pie circle chart. 12 section. circle graph for infographic. — Stock Photo, Image
Diagram
Diagram — Stock Photo, Image
Pie Chart Represents Financial Report And Data
Pie Chart Represents Financial Report And Data — Stock Photo, Image
Colorful background for financial or business theme
Colorful Background Financial Business Theme — Stock Photo, Image
Percentage signs promotion offer for sales discount 3D illustration
Percentage signs promotion offer for sales discount 3D illustration — Stock Photo, Image
Abstract business pie chart made concrete
Abstract Business Pie Chart Made Concrete — Stock Photo, Image
Percent icon on blue background.Copy space. finance concept 3d rendering
Percent Icon Blue Background Copy Space Finance Concept Rendering — Stock Photo, Image
3D business chart illustration, grid in background
Business Chart Illustration Grid Background — Stock Photo, Image
Pie chart on isolated background
Pie chart on isolated background — Stock Photo, Image
Set of different pie chart on isolated background
Set of different pie chart on isolated background — Stock Photo, Image
3D business chart illustration, white background
Business Chart Illustration White Background — Stock Photo, Image
Business pie chart. 3d rendering
Business Pie Chart Rendering — Stock Photo, Image
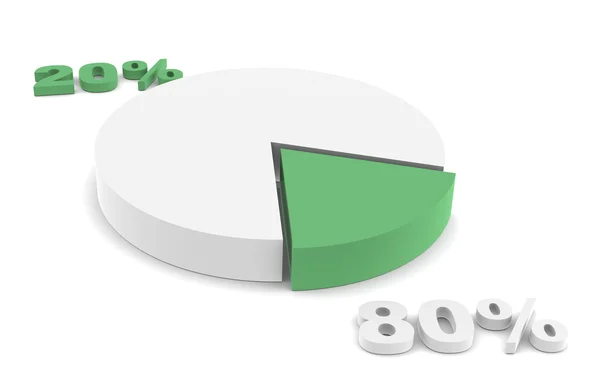
80-20 rule. Green
80-20 rule. Green — Stock Photo, Image
Golden zero percentage sign. Mathematics, statistics, science or business symbol. 3D illustration
Golden Zero Percentage Sign Mathematics Statistics Science Business Symbol Illustration — Stock Photo, Image
80% number 3d illustration on beige background
Number Illustration Beige Background — Stock Photo, Image
Multicolored pie chart
Multicolored pie chart — Stock Photo, Image
3D illustration of charts. Graphic and bars.
Illustration Charts Graphic Bars — Stock Photo, Image
3d pie chart graph
3d pie chart graph — Stock Photo, Image
Colorful pie chart graph icon 3d illustration, minimal 3d render illustration on on pastel Sprout background.
Colorful Pie Chart Graph Icon Illustration Minimal Render Illustration Pastel — Stock Photo, Image
Discount percent sign icon. Star symbol.
Discount percent sign icon. Star symbol. — Stock Photo, Image
Pizza cubic letters with 3D icon on the top - 3D illustration for food and cheese
Pizza Cubic Letters Icon Top Illustration Food Cheese — Stock Photo, Image
Digital charts illustration
Digital charts illustration — Stock Photo, Image
2016 02 04 - Color diagram - 3d chart - on a light background with reflections.
2016 02 04 - Color diagram - 3d chart - on a light background with reflections. — Stock Photo, Image
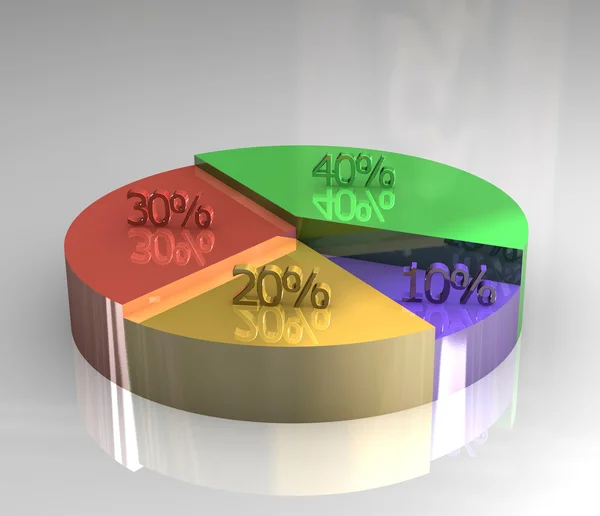
3d pictograph of pie chart
3d pictograph of pie chart — Stock Photo, Image
Pie chart on isolated background
Pie chart on isolated background — Stock Photo, Image
Préparatifs Soldes
Préparatifs Soldes — Stock Photo, Image
2016 02 04 - Color diagram - 3d chart - on a light background with reflections.
2016 02 04 - Color diagram - 3d chart - on a light background with reflections. — Stock Photo, Image
Set of Chart Graphics
Set of Chart Graphics — Stock Photo, Image
Graph concept
Graph concept — Stock Photo, Image
Glossy golden pie chart or circular graph
Glossy golden pie chart or circular graph — Stock Photo, Image
3d render of percent symbol
Render Percent Symbol — Stock Photo, Image
Business chart.
Business chart. — Stock Photo, Image
Pencil with the diagramme
Pencil with the diagramme — Stock Photo, Image
Collage from 9 three-dimensional diagrams. icons.
Collage from 9 three-dimensional diagrams. icons. — Stock Photo, Image
Data analysis pie chart icon
Data Analysis Pie Chart Icon — Stock Photo, Image
Colorful chalk pie chart graphic drawing with percentage on chalkboard or blackboard as business work distribution analysis concept
Colorful Chalk Pie Chart Graphic Drawing Percentage Chalkboard Blackboard Business — Stock Photo, Image
Diagram
Diagram — Stock Photo, Image
Pie chart
Pie chart — Stock Photo, Image
Pie chart template. Colorful 3D rendering illustration.
Pie chart template. Colorful 3D rendering illustration. — Stock Photo, Image
Black pie chart with one red sector on white background. Infographic mockup. 3D render illustration
Black Pie Chart One Red Sector White Background Infographic Mockup — Stock Photo, Image
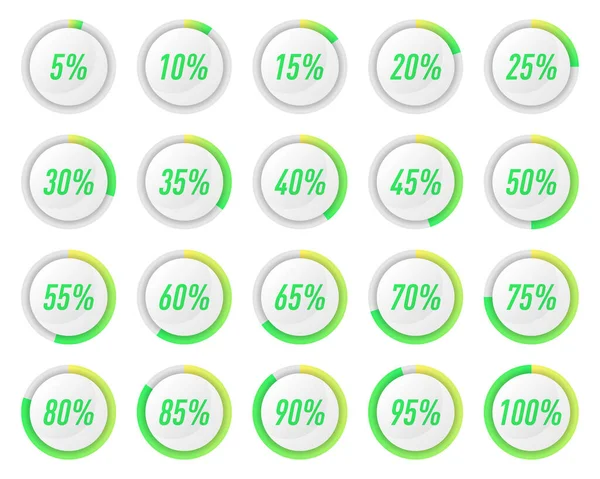
Collection of green circle percentage diagrams for infographics
Collection Green Circle Percentage Diagrams Infographics — Stock Photo, Image
Business chart.
Business chart. — Stock Photo, Image
Pie chart in white background
Pie Chart White Background — Stock Photo, Image
Percentage signs promotion offer for sales discount 3D illustration
Percentage signs promotion offer for sales discount 3D illustration — Stock Photo, Image
Seafood Pizza Slice
Seafood Pizza Slice — Stock Photo, Image
Colorful background for financial or business theme
Colorful Background Financial Business Theme — Stock Photo, Image
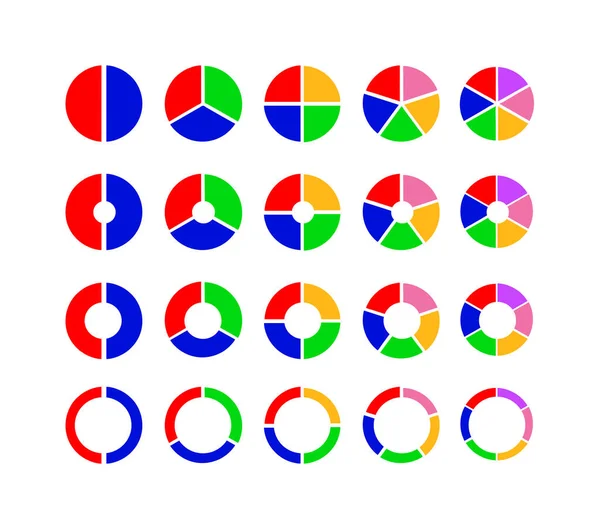
Pie chart set of 20 colourful flat circular diagrams, consisting of 2, 3, 4, 5 and 6 sections or steps respectively, isolated on a white background.
Pie Chart Set Colourful Flat Circular Diagrams Consisting Sections Steps — Stock Photo, Image
Colorful pie chart
Colorful pie chart — Stock Photo, Image
3D Silver Percentages
3D Silver Percentages — Stock Photo, Image
Layered pie chart
Layered pie chart — Stock Photo, Image
Pie chart in white background
Pie Chart White Background — Stock Photo, Image
3d Render 85 percent in white, red, silver and gold
3d Render 85 percent in white, red, silver and gold — Stock Photo, Image
Illustration of financial results
Illustration of financial results — Stock Photo, Image
Sale, 10 to 90 % off
Sale, 10 to 90 % off — Stock Photo, Image
Percent mark in comic silent
Percent Mark Comic Silent — Stock Photo, Image
A colorful 3d pie chart graph
A colorful 3d pie chart graph — Stock Photo, Image
Pie Chart 60 40 percent
Pie Chart 60 40 percent — Stock Photo, Image
Bussines symbols. 3D wood percentage
Bussines symbols. 3D wood percentage — Stock Photo, Image
Set of different kind of pizza like Vegetarian pizza, quattro formaggi and pizza with salami and mushrooms, isolated on white background, top view
Set Different Kind Pizza Vegetarian Pizza Quattro Formaggi Pizza Salami — Stock Photo, Image
Kiwano icon symbol. Premium quality isolated exotic melon element in trendy style.
Kiwano icon symbol. Premium quality isolated exotic melon element in trendy style. — Stock Photo, Image
Kiwano icon symbol. Premium quality isolated exotic melon element in trendy style.
Kiwano icon symbol. Premium quality isolated exotic melon element in trendy style. — Stock Photo, Image
Buttons symbol Illustration
Buttons symbol Illustration — Stock Photo, Image
White pie chart with one red sector on white background. Infographic mockup. 3D render illustration
White Pie Chart One Red Sector White Background Infographic Mockup — Stock Photo, Image
Percent
Percent — Stock Photo, Image
Sale banner discount 70 percent, seasonal shopping promo advertisement, vector design
Sale Banner Discount Percent Seasonal Shopping Promo Advertisement Vector Design — Stock Photo, Image
Discount Concepts - Set of 3D Illustrations.
Discount Concepts  - Set of 3D Illustrations. — Stock Photo, Image
Pie chart
Pie chart — Stock Photo, Image
Pie chart
Pie chart — Stock Photo, Image
Diagram
Diagram — Stock Photo, Image
Set of red discounts with percentage on white background
Set Red Discounts Percentage White Background — Stock Photo, Image
Finances
Finances — Stock Photo, Image
Business connecting cubes chart in a hand
Business Connecting Cubes Chart Hand — Stock Photo, Image
Pie Chart Shows Business Graph And Graphic
Pie Chart Shows Business Graph And Graphic — Stock Photo, Image
Business connecting cubes chart in a hand
Business Connecting Cubes Chart Hand — Stock Photo, Image
Business chart.
Business chart. — Stock Photo, Image
3d Business charts, Diagrams. business plan for the year
3d Business charts, Diagrams. business plan for the year — Stock Photo, Image
Data analysis pie chart icon
Data Analysis Pie Chart Icon — Stock Photo, Image
Raster illustration blue round, circle pie graph, chart with percentage 10 20 25 30 40 50 60 70 75 80 90 100 icon set
Raster Illustration Blue Circle Pie Graph Chart Percentage 100 Icon — Stock Photo, Image
Pie graph set
Pie graph set — Stock Photo, Image
0 percent blue web flat icon
0 percent blue web flat icon — Stock Photo, Image

Stock Images: Enhance Your Presentations with Stunning Pie Charts Images

If you are in search of beautiful and impactful images to upgrade your presentations, look no further! Our collection of stock images offers a wide variety of pie charts images that will elevate your visual content to new heights. Whether you need to create engaging presentations, craft informative reports, or design eye-catching marketing materials, our images are versatile and can be easily incorporated into any project. With formats like JPG, AI, and EPS, you have the freedom to choose the file type that suits your needs best. Let's dive into the details of these captivating pie charts images and how they can take your work to the next level.

1. Captivating and Informative Pie Charts

Our stock images boast a stunning array of pie charts that combine both visual appeal and informational depth. These charts break down complex data into visually digestible segments that captivate your audience and communicate your message effectively. Whether you are presenting financial data, market analysis, or survey results, our pie charts images will engage and inform your viewers. Choose from a range of styles, colors, and designs to find the perfect chart that complements your content and enhances its overall impact.

2. Versatile Usage in Various Projects

The pie charts images in our collection are incredibly versatile and can be used in a myriad of projects. Whether you are a business professional, educator, or marketer, you can utilize these images to add value to your work. Incorporate them into presentations to visually represent data, infographics to simplify complex information, or reports to provide visual summaries. The possibilities are endless! Our images are suitable for both digital and print projects, allowing you to seamlessly integrate them into websites, social media posts, brochures, or even large-scale banners.

3. Practical Tips for Effective Image Utilization

As with any visual content, it's important to use images correctly to maximize their impact. Here are some practical tips to consider when incorporating pie charts images into your projects:

a) Choose Relevant and Accurate Images: Ensure that the pie charts you select accurately represent the data you wish to convey. Use images that are contextually relevant and align with your overall message.

b) Consider Color and Design: Pay attention to the color scheme and design elements of the charts. Choose colors that evoke the desired emotions and maintain consistency with your brand or project theme.

c) Size and Placement: Select the appropriate size for your images, considering the medium in which they will be presented. Additionally, strategically place the charts within your content to enhance understanding and engagement.

d) Keep it Simple and Clear: Avoid cluttering your visuals with excessive information. Keep your charts clean and concise, allowing your audience to grasp the key insights effortlessly.

4. Accessible File Formats for Seamless Integration

Our pie charts images are available in the widely-used file formats of JPG, AI, and EPS. JPG files offer high-quality images that are compatible with almost any software or platform. AI and EPS formats, on the other hand, provide vector-based images that can be easily resized without loss of quality. While SVG, another popular format, is not available, our selection of JPG, AI, and EPS files ensures compatibility and ease of integration into various projects.

In conclusion, our collection of captivating pie charts images is an invaluable resource to enhance your presentations, reports, and marketing materials. With their ability to simplify complex data, engage audiences, and portray information effectively, these images will amplify the impact of your content. Remember to use these images strategically and consider practical tips for optimal utilization. So why wait? Elevate your visual content and leave a lasting impression with our exceptional pie charts images today!