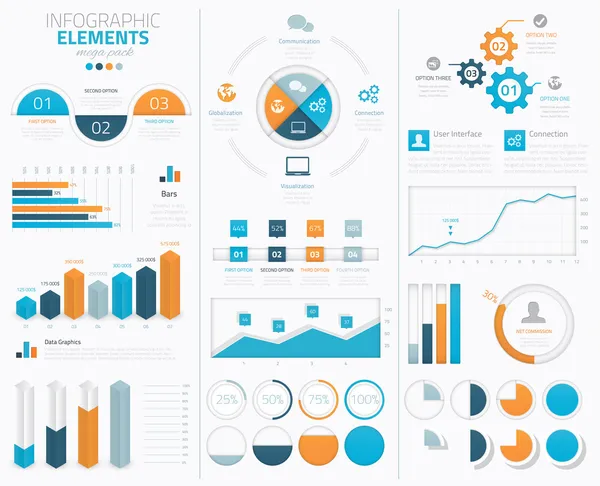
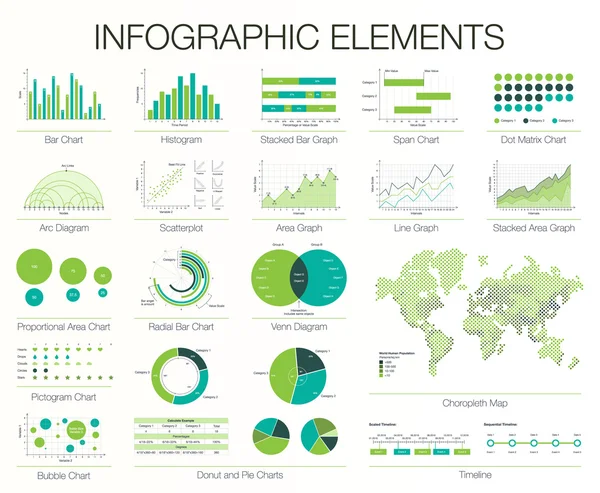
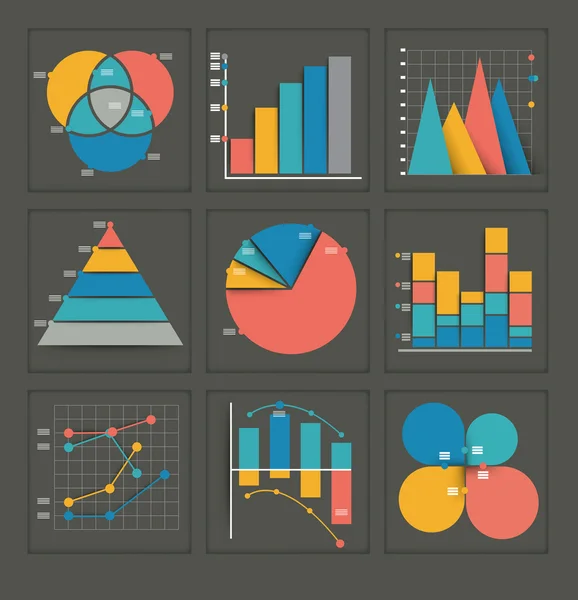
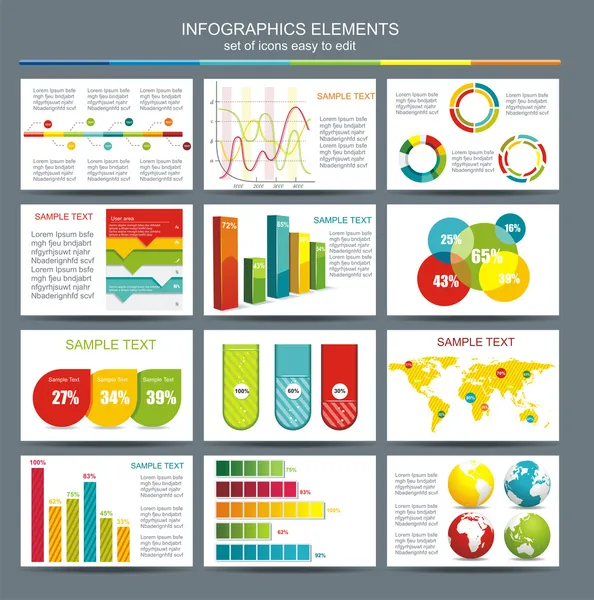
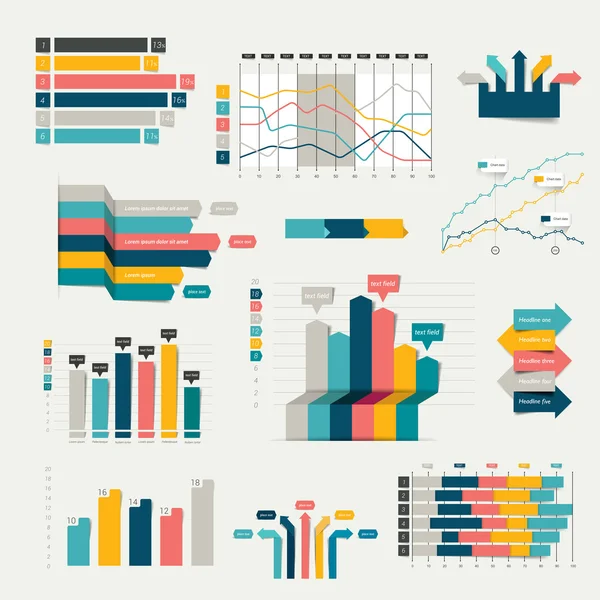
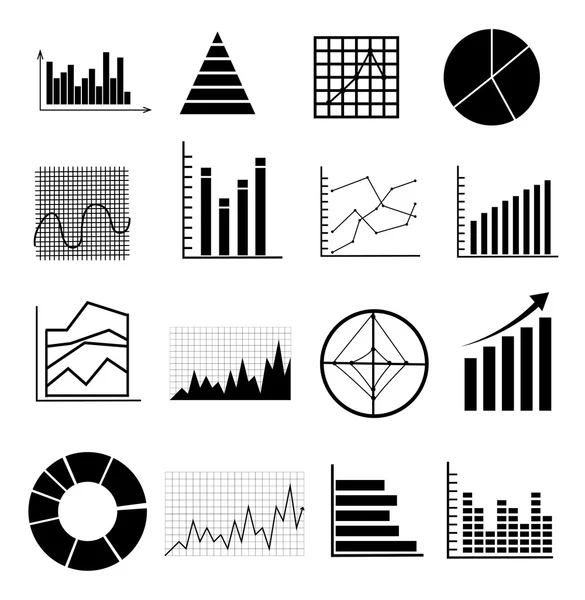
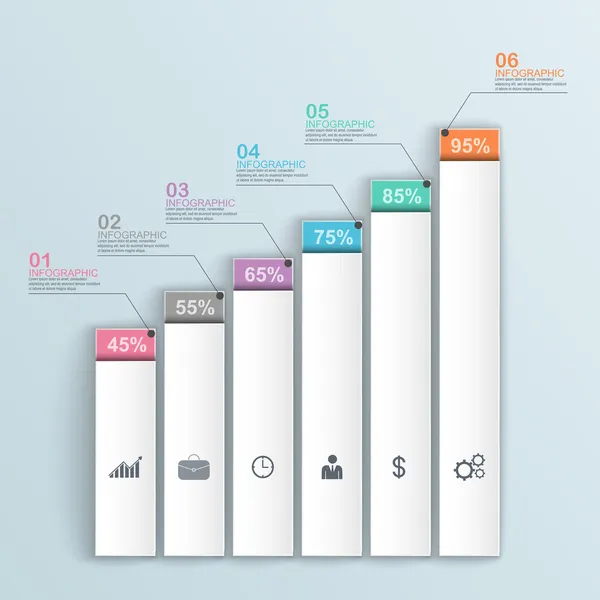
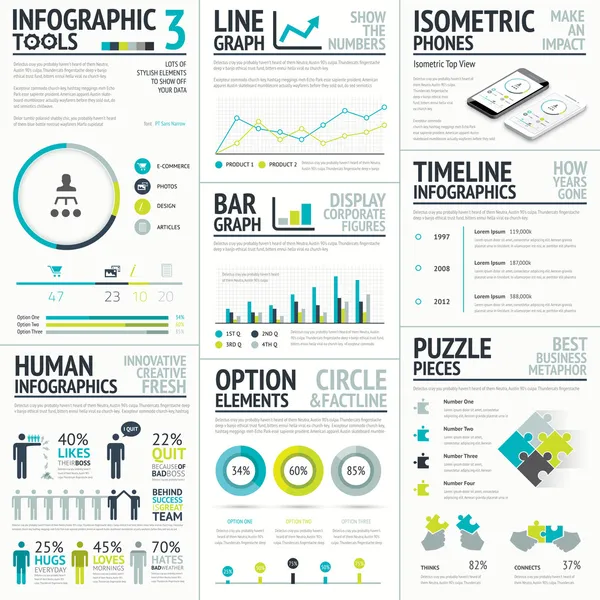
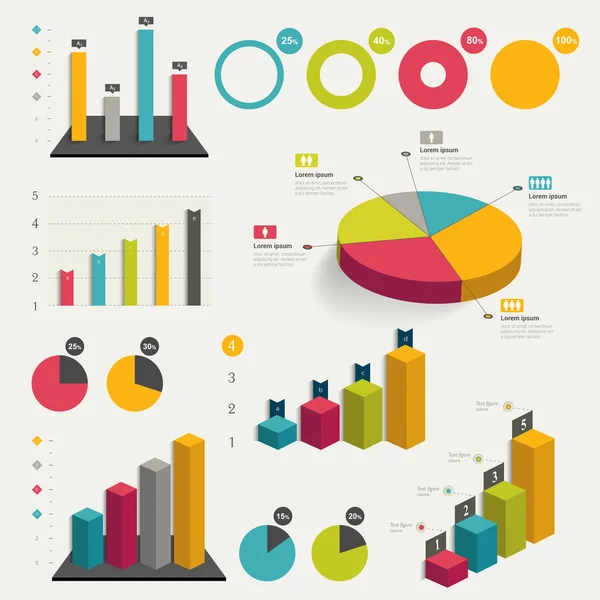
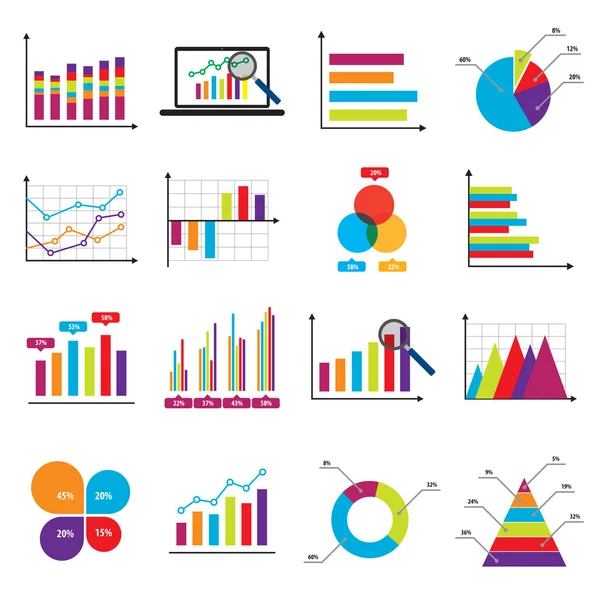
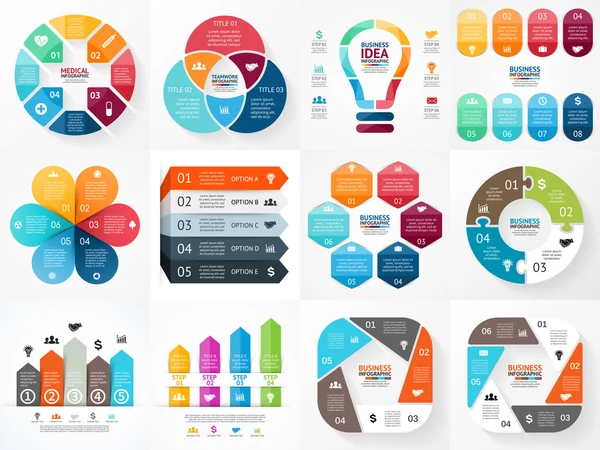
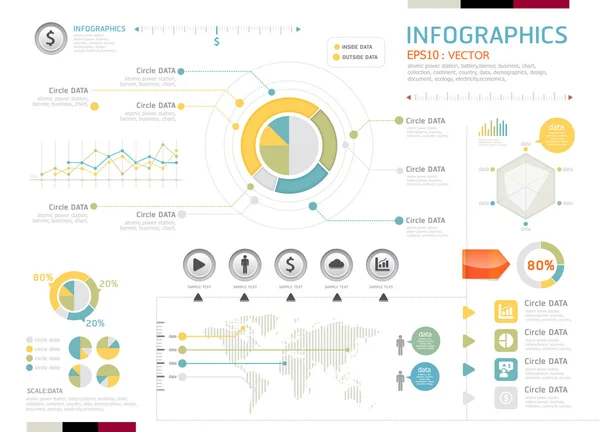
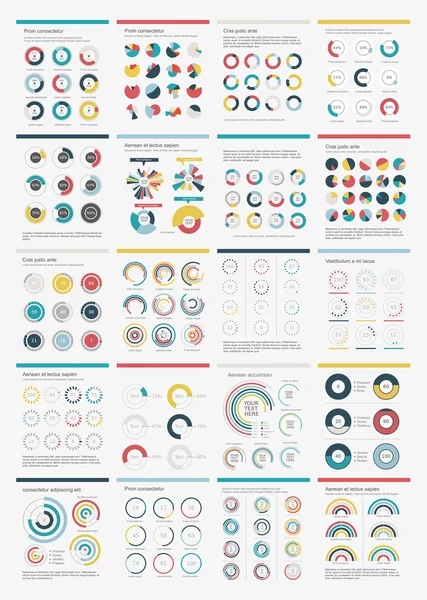
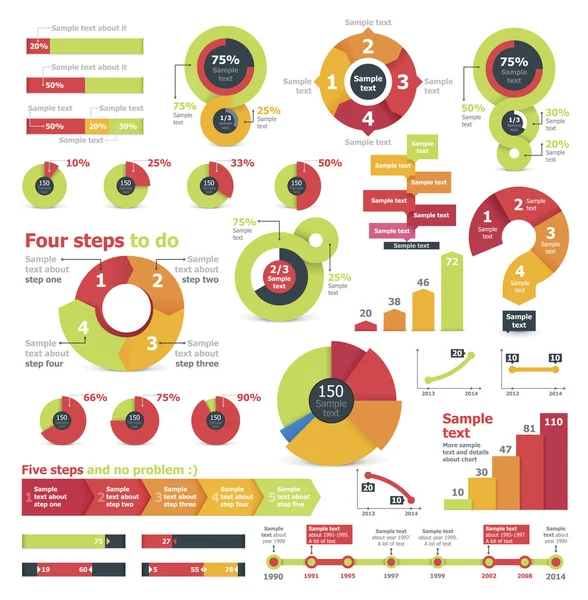
Big infographic vector elements collection to display data
Big infographic vector elements collection to display data — Stock Vector
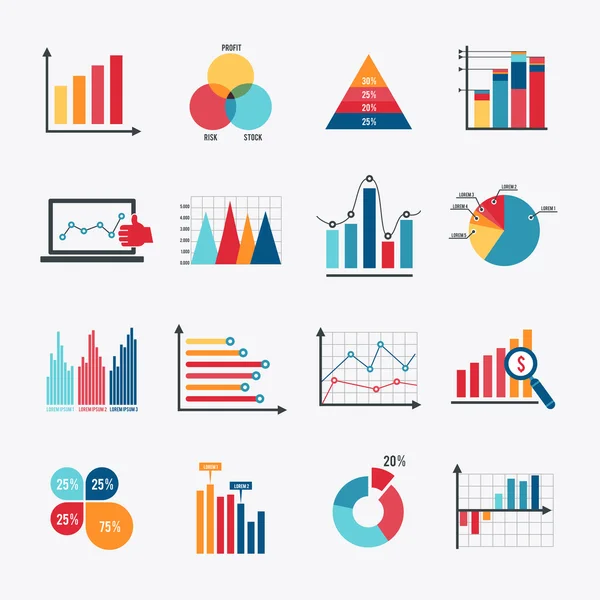
Business Chart Icons Set Flat
Business Chart Icons Set Flat — Stock Vector
Chart, graph, scheme. Simply color editable. Infographics element. Vector.
Chart Graph Scheme Simply Color Editable Infographics Element Vector — Stock Vector
Business charts
Business charts — Stock Vector
Business Growth & Development
Business Growth & Development — Stock Vector
Pictograph of graph in hand
Pictograph of  graph in hand — Stock Vector
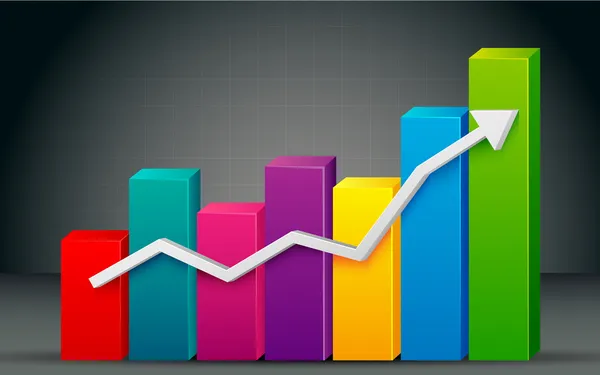
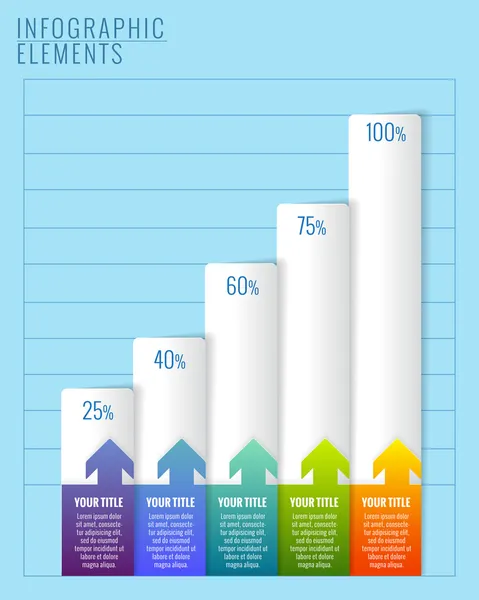
Colorful Bar Graph
Colorful Bar Graph — Stock Vector
Infographics Template. Set of design elements
Infographics Template. Set of design elements — Stock Vector
Bar Graph
Bar Graph — Stock Vector
Growth & Progress Bar Chart
Growth & Progress Bar Chart — Stock Vector
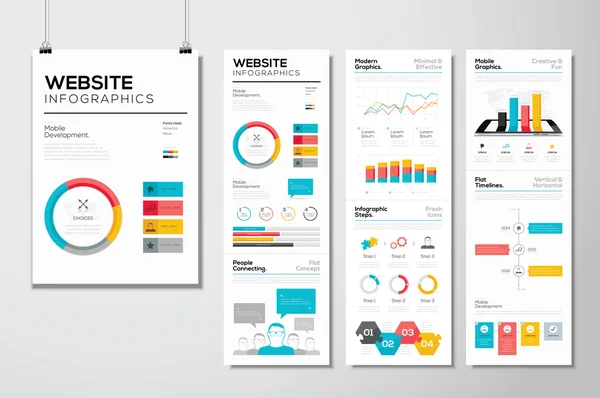
Flat web design & website infographics business vector elements
Flat web design & website infographics business vector elements — Stock Vector
Infographics vector design template. Creative diagram.
Infographics vector design template. Creative diagram. — Stock Vector
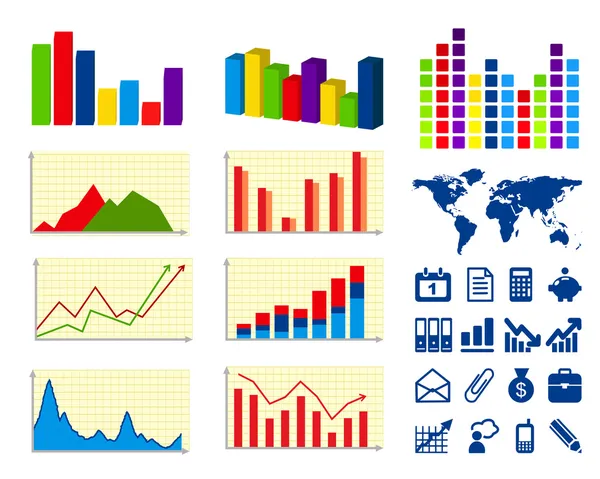
Set of colored business graphs
Set of colored business graphs — Stock Vector
Detail infographic vector illustration. World Map and Informatio
Detail infographic vector illustration. World Map and Informatio — Stock Vector
Vector Business Graph on Display Icon
Vector Business Graph on Display Icon — Stock Vector
Set of business flat, 3D design graph. Infographics charts.
Set of business flat, 3D design graph. Infographics charts. — Stock Vector
Analyse graphs charts icons set
Analyse graphs charts icons set — Stock Vector
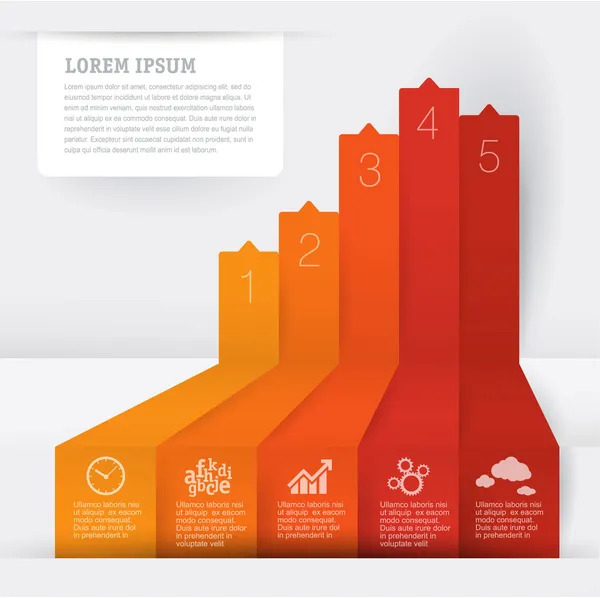
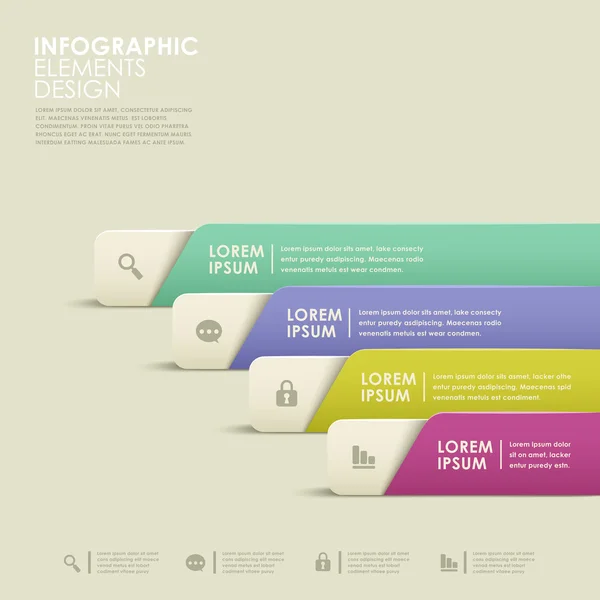
Abstract paper infographic
Abstract paper infographic — Stock Vector
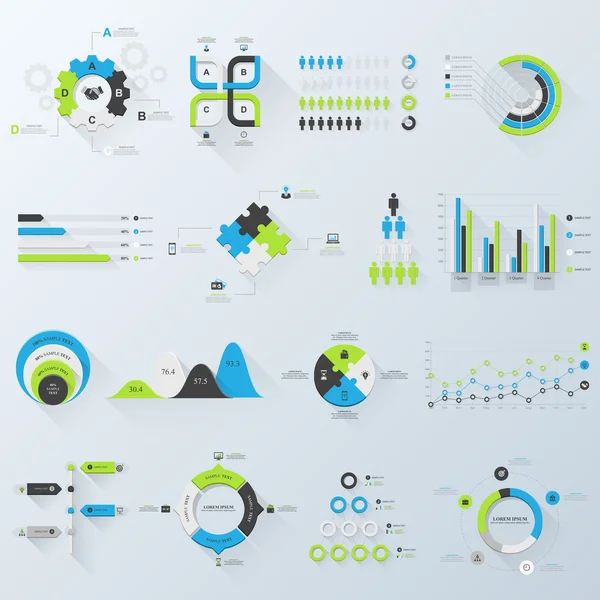
Business and human vector infographic element big set collection
Business and human vector infographic element big set collection — Stock Vector
Set of business flat, 3D design graph. Infographics charts.
Set of business flat, 3D design graph. Infographics charts. — Stock Vector
Silhouette with color bar Statistics
Silhouette with color bar Statistics — Stock Vector
Business data market charts diagrams and graphs
Business data market charts diagrams and graphs — Stock Vector
Bar Graph
Bar Graph — Stock Vector
Transparent Vector set of Infographic elements
Transparent Vector set of Infographic elements — Stock Vector
Vector set of Infographic elements
Vector set of Infographic elements — Stock Vector
Business Graphics icon
Business Graphics icon — Stock Vector
Graphic charts diagrams
Graphic charts diagrams — Stock Vector
Vector infographics set. Collection of templates for cycle diagram, graph, presentation and round chart. Business concept with options, parts, steps or processes.
Vector infographics set. Collection of templates for cycle diagram, graph, presentation and round chart. Business concept with options, parts, steps or processes. — Stock Vector
Information graphic
Information graphic — Stock Vector
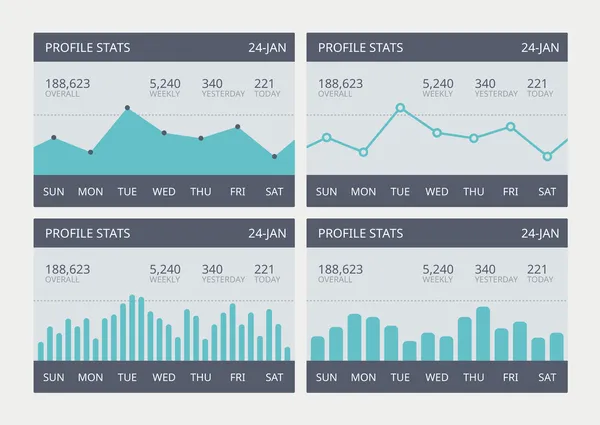
Flat ui design infographic
Flat ui design infographic — Stock Vector
Business aorund Bar Graph
Business aorund Bar Graph — Stock Vector
Vector growing graph chart background.
Vector growing graph chart background. — Stock Vector
Infographic elements. Modern business steps to success chart
Infographic elements. Modern business steps to success chart — Stock Vector
3d arrow and graph growing up. Vector illustration
3d arrow and graph growing up. Vector illustration — Stock Vector
Bar Graph
Bar Graph — Stock Vector
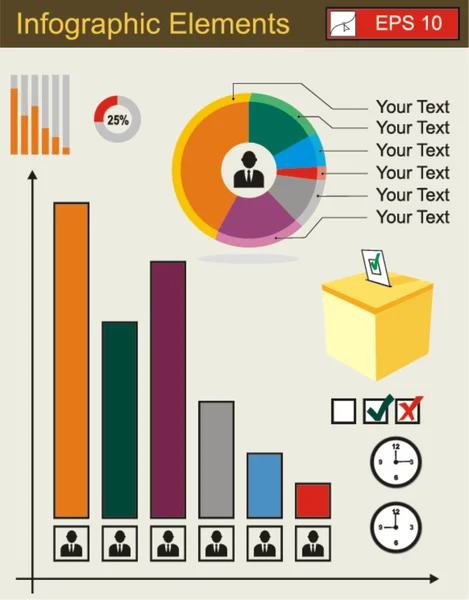
Election info-graphic charts
Election info-graphic charts — Stock Vector
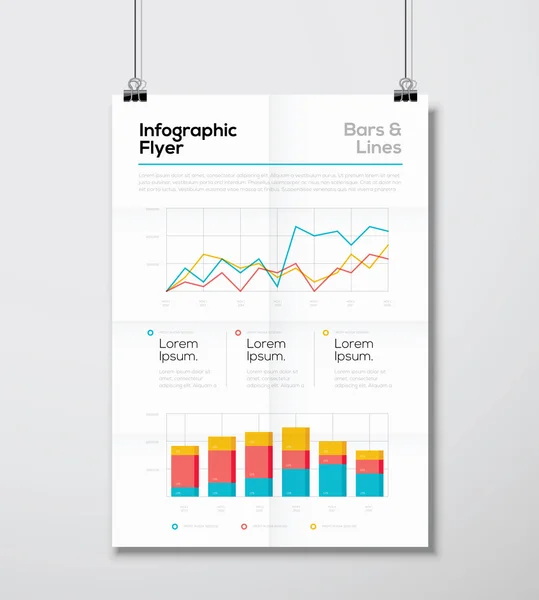
Detail infographic business flyer with line and bar graph vector
Detail infographic business flyer with line and bar graph vector — Stock Vector
Music Equaliser
Music Equaliser — Stock Vector
Tablet screen with graph and a hand
Tablet screen with graph and a hand — Stock Vector
Business infographics
Business infographics — Stock Vector
Business charts
Business charts — Stock Vector
Simple color financial management reports icon
Simple color financial management reports icon — Stock Vector
Bar shiny 3d graph positive arrow
Bar shiny 3d graph positive arrow — Stock Vector
Graph and diagram icon set.
Graph and diagram icon set. — Stock Vector
Business in the decline stage
Business in the decline stage — Stock Vector
Bar chart of 4 growing columns. 3D isometric colorful vector graph. Economical growth, increase or success theme
Bar chart of 4 growing columns. 3D isometric colorful vector graph. Economical growth, increase or success theme — Stock Vector
Infographic set with colorful charts and diagram
Infographic set with colorful charts and diagram — Stock Vector
Bar Chart blue and red four color minimal icon set
Bar Chart Blue Red Four Color Minimal Icon Set — Stock Vector
Infographics design template
Infographics design template — Stock Vector
Graph vector glyph flat icon
Graph Vector Glyph Flat Icon — Stock Vector
Vector growing graph icon
Vector growing graph icon — Stock Vector
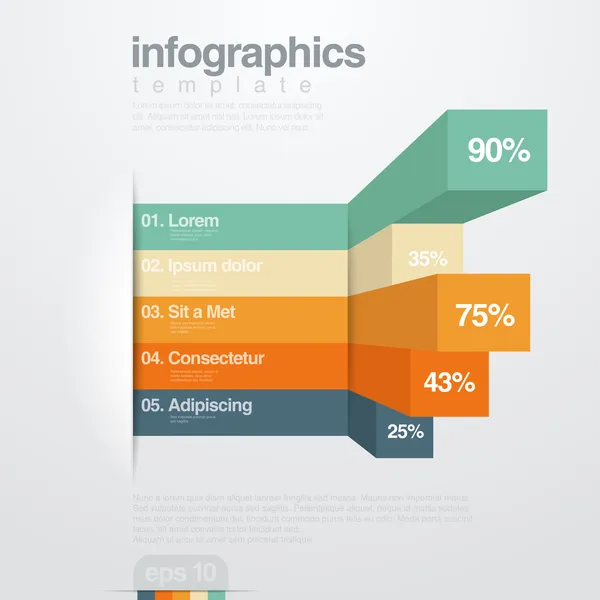
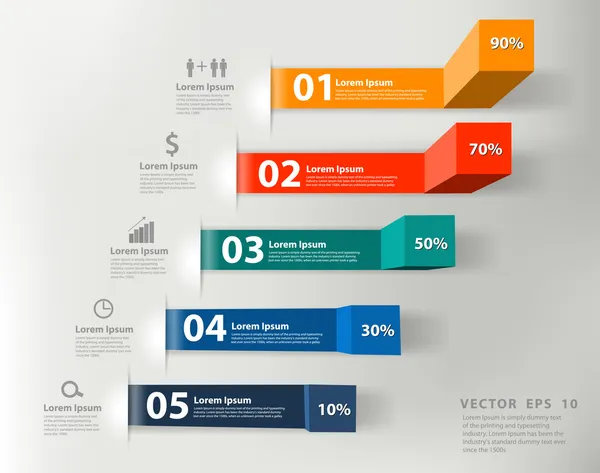
Infographics vector design template. Paper Ribbons.
Infographics vector design template. Paper Ribbons. — Stock Vector
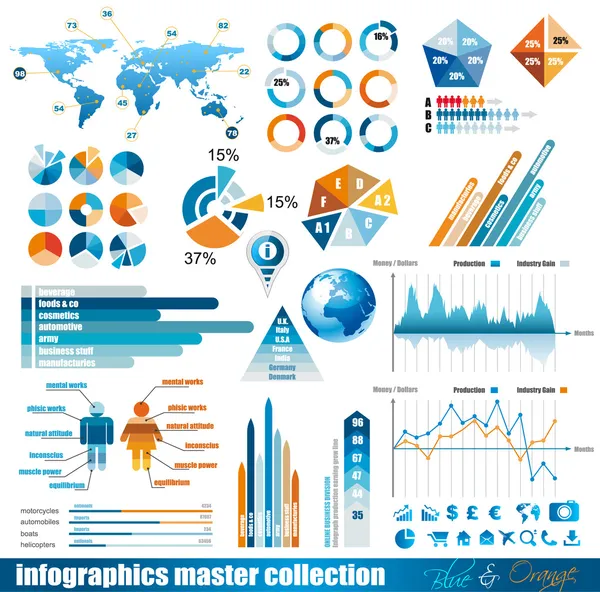
Premium infographics master collection
Premium infographics master collection — Stock Vector
Set of cryptocurrency coin symbols, icons, signs, emblems.
Set of cryptocurrency coin symbols, icons, signs, emblems. — Stock Vector
Pictograph of graph in hand
Pictograph of  graph in hand — Stock Vector
Template layout design with cover page for company profile ,annual report , brochures, flyers, presentations, leaflet, magazine,book . and vector a4 size for editable.
Template Layout Design Cover Page Company Profile Annual Report Brochures — Stock Vector
Infographics Elements for Business
Infographics Elements for Business — Stock Vector
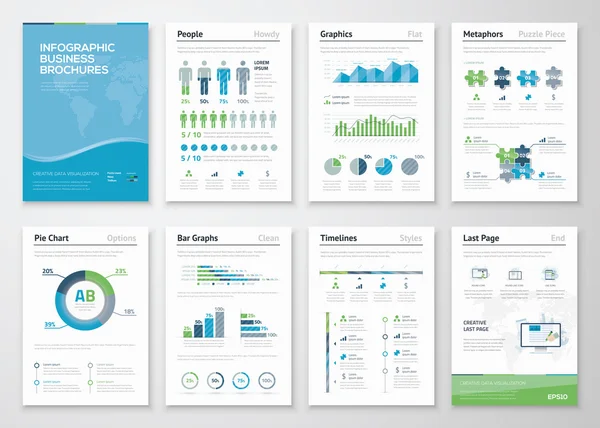
Infographics brochure elements for business data visualization
Infographics brochure elements for business data visualization — Stock Vector
Modern business steps to success charts and graphs options banner
Modern business steps to success charts and graphs options banner — Stock Vector
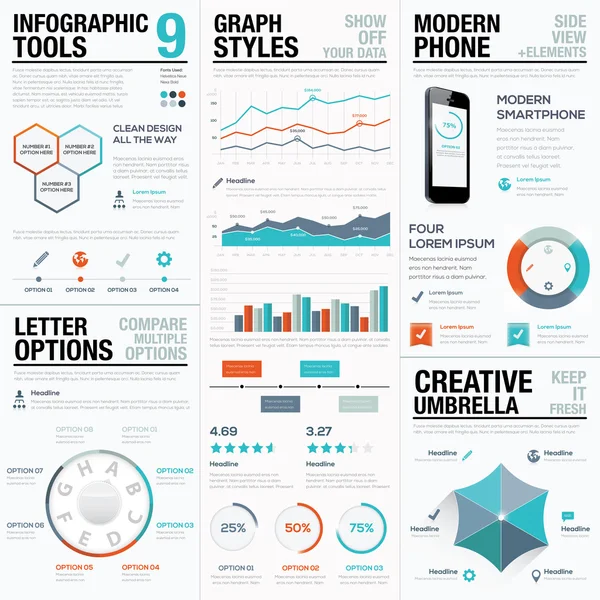
Modern statistics and info graphic vector elements for business
Modern statistics and info graphic vector elements for business — Stock Vector
Bar Graph minimal bright yellow material icon
Bar Graph Minimal Bright Yellow Material Icon — Stock Vector
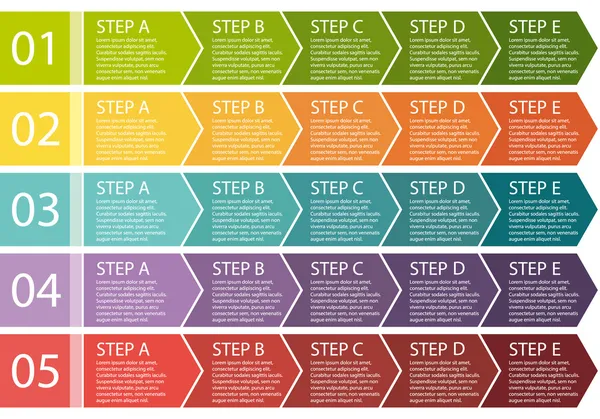
Flat design. Process arrows boxes. Step by step vector set. Five steps.
Flat design. Process arrows boxes. Step by step vector set. Five steps. — Stock Vector
Vector illustration of business diagram.
Vector Illustration Business Diagram — Stock Vector
Charts vector set.
Charts vector set. — Stock Vector
Color Graph Chart Icons Set. Vector
Color Graph Chart Icons Set. Vector — Stock Vector
Set of diagram and graphs. Infographics Elements in Modern Flat Business Style. For your design.
Set of diagram and graphs. Infographics Elements in Modern Flat Business Style. For your design. — Stock Vector
Infographic elements, vector design
Infographic Elements Vector Design — Stock Vector
Set of Business Infographics elements.
Set of Business Infographics elements. — Stock Vector
Business Graphics icon
Business Graphics icon — Stock Vector
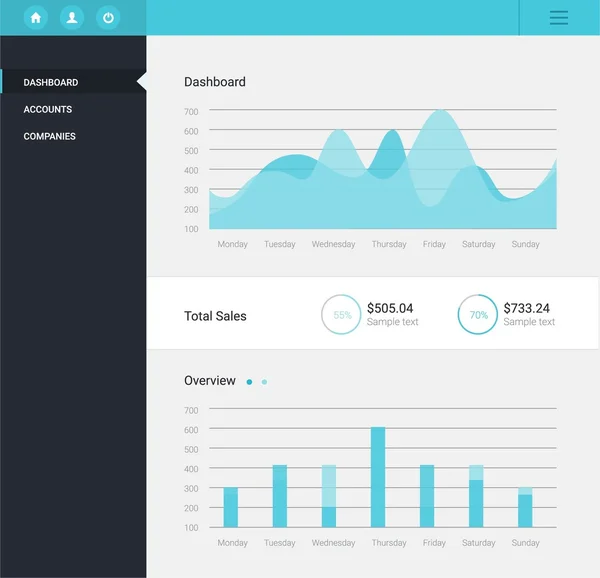
Infographic dashboard template with flat design graphs and charts. Processing and analysis of data
Infographic dashboard template with flat design graphs and charts. Processing and analysis of data — Stock Vector
Bar Graph and Pie Chart
Bar Graph and Pie Chart — Stock Vector
Set of Vector Graphs and Diagrams for Infographics
Set of Vector Graphs and Diagrams for Infographics — Stock Vector
3D Growth bar graph. Vector business concept.
3D Growth bar graph. Vector business concept. — Stock Vector
Graphs and charts set. Statistic and data, information infographic.
Graphs and charts set. Statistic and data, information infographic. — Stock Vector
Color Graph Chart Icons Set. Vector
Color Graph Chart Icons Set. Vector — Stock Vector
Different of respirator masks for prevention coronavirus from covid. Respirator masks consisting of covid accessory with prevention coronavirus. Respirator masks covid is main prevention coronavirus.
Different Respirator Masks Prevention Coronavirus Covid Respirator Masks Consisting Covid — Stock Vector
Summer Icons Four gray series
Summer Icons Four gray series — Stock Vector
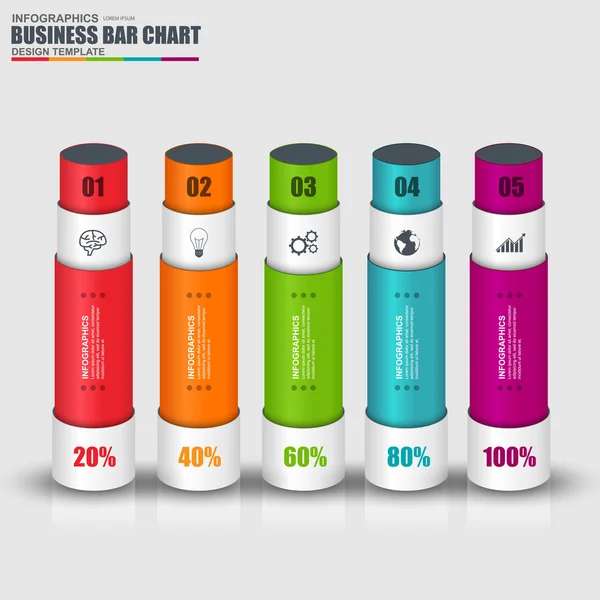
Infographic vector design template marketing bar chart elements. Can be used for workflow layout, data visualization, business concept with 5 options, parts, steps, banner, diagram, web design.
Infographic vector design template marketing bar chart elements. Can be used for workflow layout, data visualization, business concept with 5 options, parts, steps, banner, diagram, web design. — Stock Vector
Infographic vector
Infographic vector — Stock Vector
Stacked bar chart of 4 columns. 3D isometric colorful vector graph
Stacked bar chart of 4 columns. 3D isometric colorful vector graph — Stock Vector
Finance background
Finance background — Stock Vector
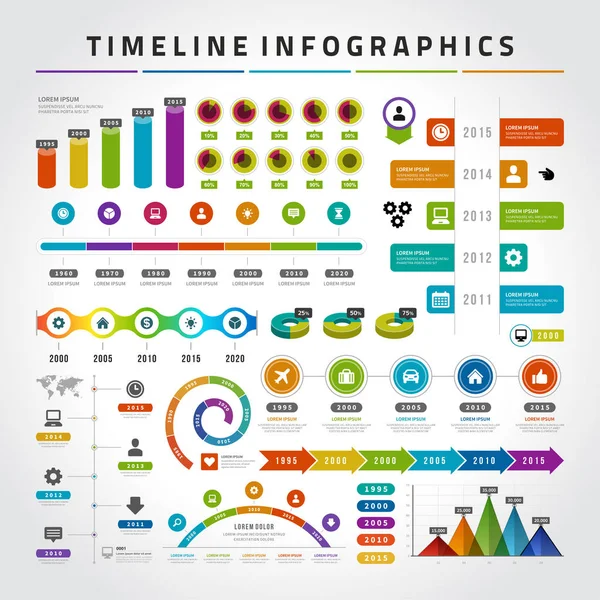
Timeline infographics design templates set. Charts, diagrams, icons, objects, vector elements for data, presentations
Timeline infographics design templates set. Charts, diagrams, icons, objects, vector elements for data, presentations — Stock Vector
Abstract business graph chart
Abstract business graph chart — Stock Vector
Infographic Elements.Big chart set icon.
Infographic Elements.Big chart set icon. — Stock Vector
Set of flat design infographic charts and graphs
Set of flat design infographic charts and graphs — Stock Vector
Economic icons, graphs
Economic icons, graphs — Stock Vector
Infographic chart template.
Infographic chart template. — Stock Vector
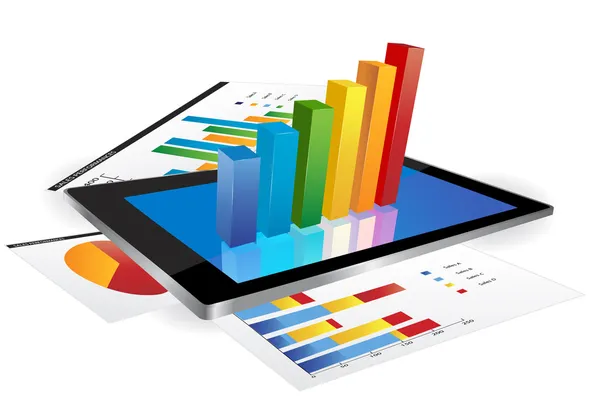
Tablet with 3d graph
Tablet with 3d graph — Stock Vector
Abstract banner infographics
Abstract banner infographics — Stock Vector
Bar chart / bar graph icons
Bar chart / bar graph icons — Stock Vector
Vector business statistic charts set
Vector business statistic charts set — Stock Vector
Vector infographic elements
Vector infographic elements — Stock Vector
Infographic design element collection. Vector flat color illustration. Bar chart isolated on white to transparent background. Design for ui, scientific poster, marketing, presentation.
Infographic Design Element Collection Vector Flat Color Illustration Bar Chart — Stock Vector
Chart vector icon which can be easily modified or edit
Chart Vector Icon Which Can Easily Modified Edit — Stock Vector
Bars statistics isolated icon
Bars statistics isolated icon — Stock Vector
Black and white arrows and columns, vector graphic
Black and white arrows and columns, vector graphic — Stock Vector
Company employee hierarchy line icon vector illustration
Company employee hierarchy line icon vector illustration — Stock Vector
Infographic design element collection. Vector flat color illustration. Stacked bar chart isolated on white to transparent background. Design for ui, scientific poster, marketing, presentation.
Infographic Design Element Collection Vector Flat Color Illustration Stacked Bar — Stock Vector
Graph chart icon vector illustration
Graph Chart Icon Vector Illustration — Stock Vector

Related vector searches

Bar Graph Vector Images: The Best Choice for Data Visualization

Vector images are essential in many visual projects, and they can be used to enhance the visual presentation of data. Among the most popular vector images are bar graph vectors, which are both elegant and dynamic. With their straightforward and efficient display of numerical information, bar graph vectors offer excellent descriptive value for many types of data. They are perfect for showcasing sales figures, statistical data, and other quantitative information that needs to be quickly and accurately interpreted. A bar graph vector can be used across a range of platforms, from corporate presentations to infographics to data visualizations.

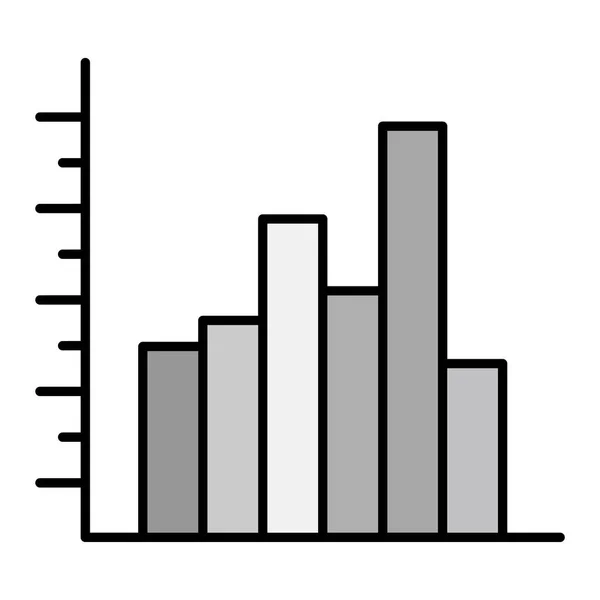
Features of a Bar Graph Vector

A bar graph vector is a visual representation of data, where the values can be presented in the form of horizontal or vertical bars. The bar is usually proportionate to the value it represents and scaled to fit the data better. Bar graph vectors can be customized and adapted to any specific design needs, including color, style, and thickness. This adaptability is a significant advantage over other graph types. Bar graphs also excel in presenting data that can be easily compared in terms of magnitude.

The use of a bar graph vector should be appropriate for the data being represented. For instance, if the scales of data are very narrow, then a bar graph vector may not be the ideal fit. For smaller numerical differences, line graphs are a better option. It's also essential that the chosen bar graph matches the graphic design of the project, incorporating existing color schemes and visual styles to ensure coherence throughout the final product. This attention to detail is what makes a good graphic designer stand out.

Benefits of a Bar Graph Vector

One of the primary advantages of using a bar graph vector is its versatility. It's easy to read and interpret since each bar represents a different value, and the ends are lined up so that comparisons can be made. A bar graph vector also makes it possible to display large quantities of data, even over extended periods, while still being easy to understand. Moreover, since vector images are scalable, they remain sharp and clear regardless of the size.

Bar graphs are also accessible and easy to create using readily available software. Simple designs can even be made using Microsoft Excel spreadsheets, which can then be exported as vector files. However, for more complex and unique designs, engaging graphics designers who specialize in creating vector images is recommended. They can create customized bar graph vectors unique to your needs, and these high-quality files can be used on pricing sheets, research presentations, and more.

Applications of Bar Graph Vectors

A bar graph vector can be used in various applications. For example, in the financial industry, they are useful in visualizing sales reports of companies and comparing their financial performance over time. Additionally, scientific researchers can use bar graph vectors to display research findings, including statistical data, analysis of results, or in charts of scientific data. Marketing personnel can also use bar graph vectors to present market metrics such as sales volumes and turnover rates for market research or to track and show growth trends.

In conclusion, if you want to elevate your data visualization game, bar graph vectors are the way to go. They are easily recognizable, clear, and customizable designs that can be used for a wide range of applications. Remember to select an appropriate bar graph vector and have it customized to suit your requirements. Overall, bar graph vectors are an excellent option that can truly enhance your visual data storytelling.