Analytics and Statistics Data on Internet Pages — Stock Vector

Analytics and Statistics Data on Internet Pages — Vector

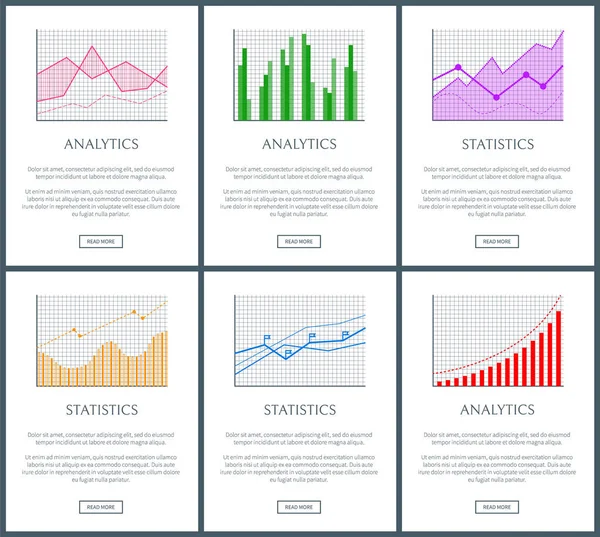
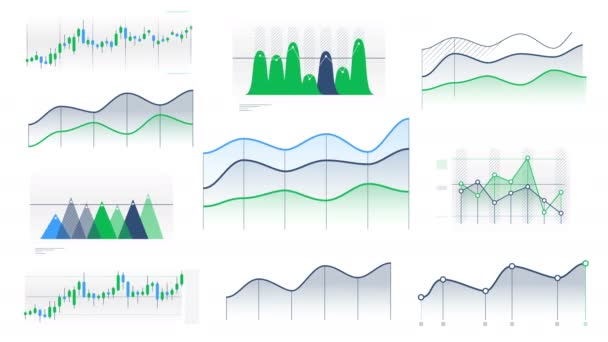
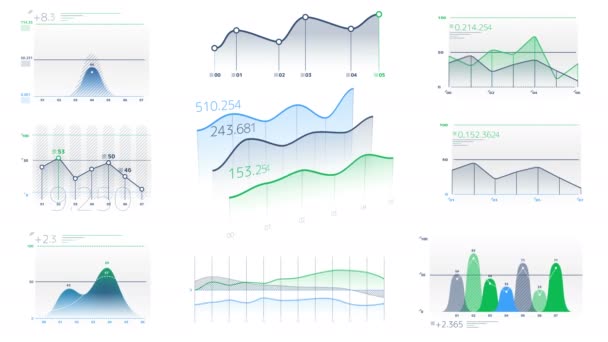
Analytics and statistics data on Internet pages templates. Bright graphics with bars and waves. Graphic to display information vector illustration.

 — Vector by robuart

Same Series:

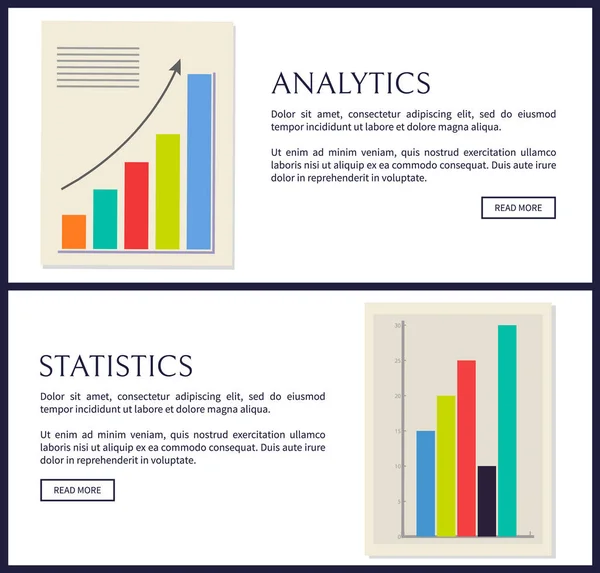
Analytics web page and text sample, headline button, chart of blue color with information, analytical vector illustration isolated on white background
Analytics Web Page and Chart Vector Illustration — Stock Vector
Statistics and analytics infographics, vector card, colorful charts, helpful economy data, growing diagrams, text sample, illustration with charts set
Statistics and Analytics Infographics, Vector Card — Stock Vector
Analytics digraph image, color vector illustration, waving chart on green grid, flexible statistic line, text sample, business data, analytical graphic
Analytics Digraph Image, Color Vector Illustration — Stock Vector
Analytics and statistics, collection of pages and visual representation, charts set, statistics and analytics vector illustration isolated on pink
Analytics Statistic Collection Vector Illustration — Stock Vector
Analytics web page and text sample, site with headlines and button, business chart with dots and curved line, vector illustration isolated on white
Analytics Web Page and Text Vector Illustration — Stock Vector
Statistics and analytics pages set and text sample charts and graphical diagrams, buttons and stat and analytical isolated on vector illustration
Statistics Analytics Pages Set Text Sample Charts Graphical Diagrams Buttons — Stock Vector
Analytics banner, colorful vector illustration, text sample, information button, waving infographic on grid, dots and dotted line, analytical data
Analytics Banner, Colorful Vector Illustration — Stock Vector
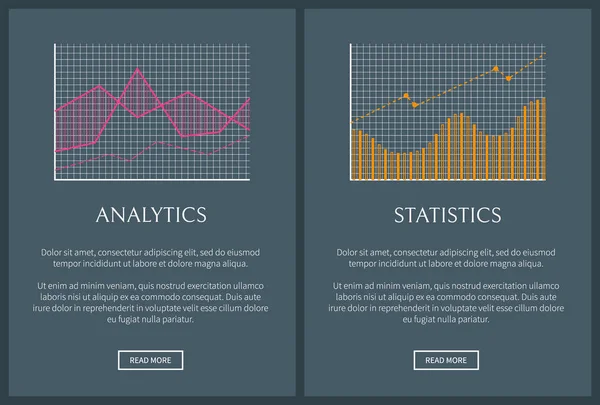
Statistics and analytics data, info graphics set, vector illustration with text sample and push buttons, data visualization in two colorful charts
Statistics and Analytics Data, Info Graphics Set — Stock Vector
Infographic chart vector template. Annual statistics curve graph design. Market data diagrams. Graphic information visualization and analysis. Statistical indicators and frequency of data changes
Infographic Chart Vector Template Annual Statistics Curve Graph Design Market — Stock Vector
Statistic presentation with multicolored bar graph for illustrating data. Vector illustration of chart with room for text and buttons
Statistic Presentation with Colorful Bar Graph — Stock Vector
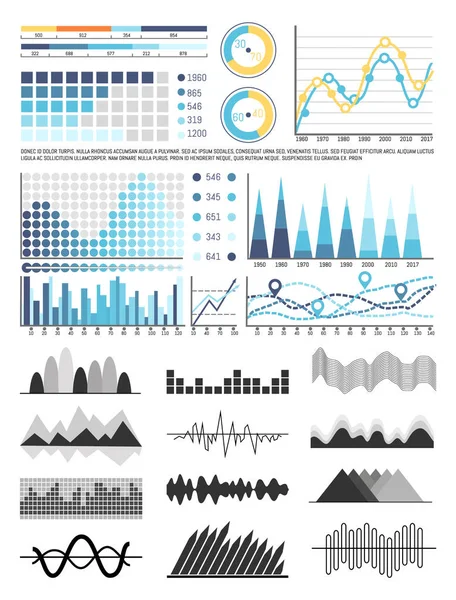
Statistic web pages, charts and infographics set vector. Scheme with lines and curves, scales with results in visual form. Infochart design and text
Statistic Web Pages, Charts and Infographics Set — Stock Vector
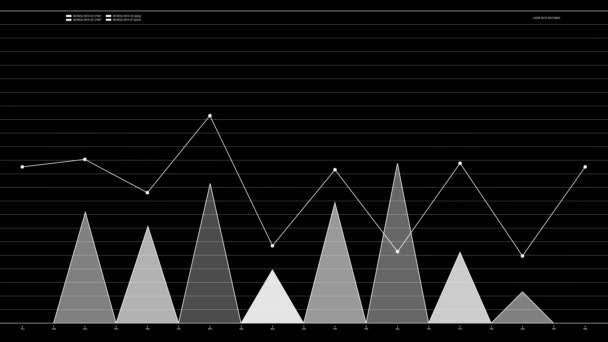
Graphics and flowcharts, schemes and charts set vector. Monochrome sketches outline of infocharts and infographics. Pie diagrams and numbers figures
Graphics and Flowcharts, Schemes and Charts Set — Stock Vector
Statistics charts and analytics color diagrams set, text sample and push buttons vector illustration, flags and grids, curved diagrams, colorful plots
Statistics Charts and Analytics Color Diagrams Set — Stock Vector
Statistic web pages with text sample, infographics vector. Layout of visualized information, business data in comparison. Schemes and flowcharts plan
Statistic Web Pages with Text Sample, Infographics — Stock Vector
Statistics plots and analytics graphs vector cards, illustration with green frames, analytics data, colorful charts set, statistics information set
Statistics Plots and Analytics Graphs Vector Cards — Stock Vector
Analytics and statistics web, internet pages with button, and informational text sample, analytical and stat and charts, vector illustration
Analytics and Statistics Web Vector Illustration — Stock Vector

Similar Stock Videos:

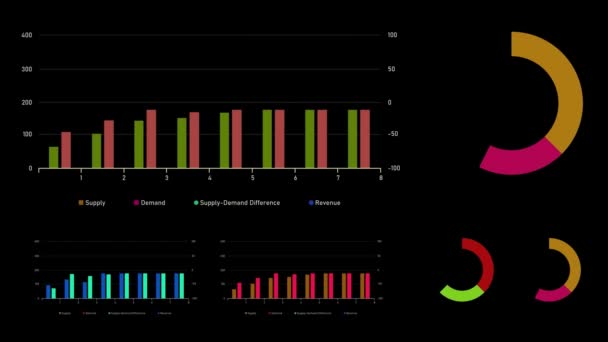
Abstract background with financial analytics and global company infographics. Moving charts and diagrams. The concept of business, success, profit growth and finance.
Background with financial analytics and global company infographics. Moving charts and diagrams. The concept of business, success, profit growth and finance. — Stock Video
Graphic bars animation economic indicators
Graphic Bars Animation Economic Indicators — Stock Video
Growing line graph of a digital income growth chart made in a technological style on a high-tech grid background. Concept for presentations, advertising and showing profitability and statistics
Growing Line Graph Digital Income Growth Chart Made Technological Style — Stock Video
Graphic bars animation economic indicators 4K UHD
Graphic Bars Animation Economic Indicators Uhd — Stock Video
Animated charts in annual export and import report, international trade outlook
Animated charts in annual export and import report, international trade outlook — Stock Video
Stock index chart on a dark blue background. Suitable for any stock market related purposes.
Stock index chart — Stock Video
Multi-colored technological background with diagrams. Concept of scientific elements.
Multi-colored technological background with diagrams. — Stock Video
Growing line graph of a digital income growth chart made in a technological style on a high-tech grid background. Concept for presentations, advertising and showing profitability and statistics
Growing Line Graph Digital Income Growth Chart Made Technological Style — Stock Video
Abstract background with financial analytics and global company infographics. Moving charts and diagrams. The concept of business, success, profit growth and finance.
Background with financial analytics and global company infographics. Moving charts and diagrams. The concept of business, success, profit growth and finance. — Stock Video
Electronic bar chart showing monthly results compared to previous year data
Electronic bar chart showing monthly results compared to previous year data — Stock Video
A set of animated color line and candlestick graphs without numbers and data on the white background.
Linear and candlestick charts without data — Stock Video
Several color graphs animated on the white background.
Color infographics on the white background — Stock Video
Four growing graph charts on a grid with a gridded background
Growing graph charts on a grid — Stock Video
Animated data graph for stats analysis, reports and financial. Ideal for financial, banking, scientific and mathematical medical topics. Animation 4k.
Animated Data Graph Stats Analysis Reports Financial Ideal Financial Banking — Stock Video
Growing line graph of a digital income growth chart made in a technological style on a high-tech grid background. Concept for presentations, advertising and showing profitability and statistics
Growing Line Graph Digital Income Growth Chart Made Technological Style — Stock Video
Growing line graph of a digital income growth chart made in a technological style on a high-tech grid background. Concept for presentations, advertising and showing profitability and statistics
Growing Line Graph Digital Income Growth Chart Made Technological Style — Stock Video
Curves showing industrial growth on line chart, computer animated data graph
Curves showing industrial growth on line chart, computer animated data graph — Stock Video

Usage Information

You can use this royalty-free vector image "Analytics and Statistics Data on Internet Pages" for personal and commercial purposes according to the Standard or Extended License. The Standard License covers most use cases, including advertising, UI designs, and product packaging, and allows up to 500,000 print copies. The Extended License permits all use cases under the Standard License with unlimited print rights and allows you to use the downloaded vector files for merchandise, product resale, or free distribution.

This stock vector image is scalable to any size. You can buy and download it in high resolution up to 5000x4126. Upload Date: Jul 13, 2018