Business Candle Stick Graph Chart Stock Market Investment Trading Bullish — Stock Vector

Business candle stick graph chart of stock market investment trading, Bullish point, Bearish point. trend of graph vector design. — Vector

Business candle stick graph chart of stock market investment trading, Bullish point, Bearish point. trend of graph vector design.

 — Vector by pondshutter@yahoo.com

Same Series:

Candle stick graph chart of stock market investment trading, Bullish point, Bearish point. trend of graph vector design.
Candle Stick Graph Chart Stock Market Investment Trading Bullish Point — Stock Vector
Financial stock market graph on stock market investment trading, Bullish point, Bearish point. trend of graph for business idea and all art work design. vector illustration.
Financial Stock Market Graph Stock Market Investment Trading Bullish Point — Stock Vector
Financial stock market graph on stock market investment trading, Bullish point, Bearish point. trend of graph for business idea and all art work design. vector illustration
Financial Stock Market Graph Stock Market Investment Trading Bullish Point — Stock Vector
Candle stick graph chart of stock market investment trading, Bullish point, Bearish point. trend of graph vector design.
Candle Stick Graph Chart Stock Market Investment Trading Bullish Point — Stock Vector
Candle stick graph chart of stock market investment trading, Bullish point, Bearish point. trend of graph vector design.
Candle Stick Graph Chart Stock Market Investment Trading Bullish Point — Stock Vector
Financial stock market graph on stock market investment trading, Bullish point, Bearish point. trend of graph for business idea and all art work design. vector illustration.
Financial Stock Market Graph Stock Market Investment Trading Bullish Point — Stock Vector
Financial stock market graph on stock market investment trading, Bullish point, Bearish point. trend of graph for business idea and all art work design. vector illustration.
Financial Stock Market Graph Stock Market Investment Trading Bullish Point — Stock Vector
Business candle stick graph chart of stock market investment trading, Bullish point, Bearish point. trend of graph vector design.
Business Candle Stick Graph Chart Stock Market Investment Trading Bullish — Stock Vector
Business candle stick graph chart of stock market investment trading, Bullish point, Bearish point. trend of graph vector design.
Business Candle Stick Graph Chart Stock Market Investment Trading Bullish — Stock Vector
Business candle stick graph chart of stock market investment trading, Bullish point, Bearish point. trend of graph vector design.
Business Candle Stick Graph Chart Stock Market Investment Trading Bullish — Stock Vector
Business candle stick graph chart of stock market investment trading, Bullish point, Bearish point. trend of graph vector design.
Business Candle Stick Graph Chart Stock Market Investment Trading Bullish — Stock Vector
Candle stick graph chart of stock market investment trading, Bullish point, Bearish point. trend of graph vector design.
Candle Stick Graph Chart Stock Market Investment Trading Bullish Point — Stock Vector
Financial stock market graph on stock market investment trading, Bullish point, Bearish point. trend of graph for business idea and all art work design. vector illustration.
Financial Stock Market Graph Stock Market Investment Trading Bullish Point — Stock Vector
Financial stock market graph on stock market investment trading, Bullish point, Bearish point. trend of graph for business idea and all art work design. vector illustration
Financial Stock Market Graph Stock Market Investment Trading Bullish Point — Stock Vector
Financial stock market graph on stock market investment trading, Bullish point, Bearish point. trend of graph for business idea and all art work design. vector illustration.
Financial Stock Market Graph Stock Market Investment Trading Bullish Point — Stock Vector
Candle stick graph chart of stock market investment trading, Bullish point, Bearish point. trend of graph vector design.
Candle Stick Graph Chart Stock Market Investment Trading Bullish Point — Stock Vector

Similar Stock Videos:

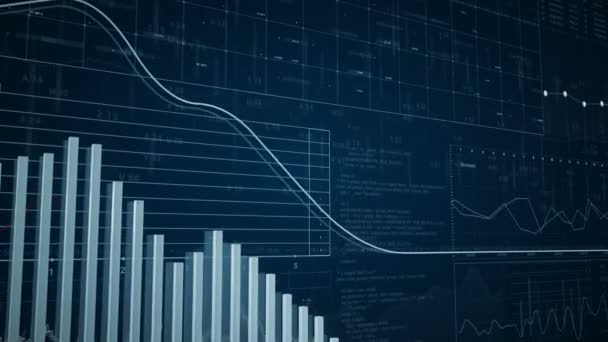
Animation of data processing over businessman working. global shipping, delivery and connections concept digitally generated video.
Animation Data Processing Businessman Working Global Shipping Delivery Connections Concept — Stock Video
Animation of statistics processing over clouds and sky. global data processing and digital interface concept digitally generated video.
Animation Statistics Processing Clouds Sky Global Data Processing Digital Interface — Stock Video
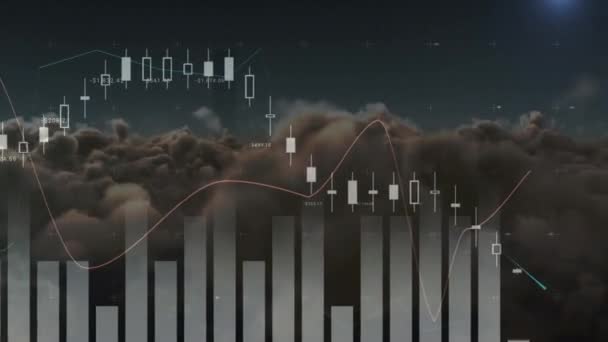
Composite video of statistical data processing against clouds in the blue sky. business statistics and data concept
Composite Video Statistical Data Processing Clouds Blue Sky Business Statistics — Stock Video
Researcher engineer touched screen, various animated Stock Market charts and graphs. Decrease line. Artificial Intelligence
Researcher Engineer Touched Screen Various Animated Stock Market Charts Graphs — Stock Video
Animation of statistics and financial data processing on grey background. business, finances and digital interface concept digitally generated video.
Animation Statistics Financial Data Processing Grey Background Business Finances Digital — Stock Video
Animation of stock market display with numbers and graphs, price going up and down at the stock exchange over data recording with industrial warehouse in the background.
Animation Stock Market Display Numbers Graphs Price Going Stock Exchange — Stock Video
Looping Bar Charts with indicator line.Graph and diagram.Equalizer.3D graphic
Bar chart with growing indicator.Business stock charts and graphics.Stock market — Stock Video
Animation of financial data processing on gray background. global business, finances, connections and digital interface concept digitally generated video.
Animation Financial Data Processing Gray Background Global Business Finances Connections — Stock Video
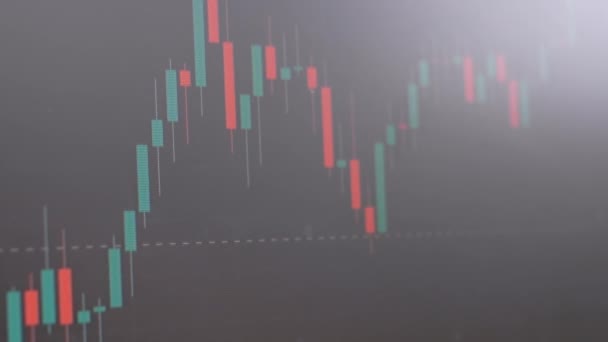
Stock exchange, cryptocurrency price chart on a computer monitor screen. Candlestick chart, btc, eth. Online currency exchange market. Trading, bidding. Tracking the cryptocurrency rate. Zoom. Close
Stock Exchange, Cryptocurrency, Candles Graph btc, eth on a Computer Screen. — Stock Video
Animation of statistics processing over cityscape. global business, finances, data processing and digital interface concept digitally generated video.
Animation Statistics Processing Cityscape Global Business Finances Data Processing Digital — Stock Video
Animation of graphs and red arrow pointing upward and data processing on a dark blue background
Animation Graphs Red Arrow Pointing Upward Data Processing Dark Blue — Stock Video
Animation of stock market display with green and blue stock market numbers and graphs, price going up and down at the stock exchange recording data in the background.
Animation Stock Market Display Green Blue Stock Market Numbers Graphs — Stock Video
Music and audio equalizer animation
Sound graphic equalizer — Stock Video
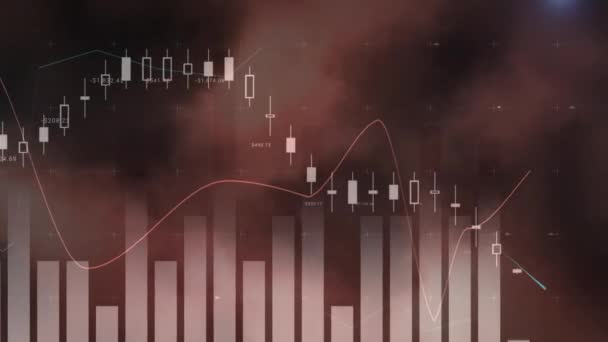
Composite video of statistical data processing against smoke clouds in red background. business statistics and data concept
Composite Video Statistical Data Processing Smoke Clouds Red Background Business — Stock Video
Video of financial data processing over dark background. global business, finances, technology and connections concept digitally generated video.
Video Financial Data Processing Dark Background Global Business Finances Technology — Stock Video
Quotes and index analysis on the background. Business and marketing.Graph and diagram.Equalizer.Indicators.Blue 3D and 2D graphic
Bar Charts.Business and stock market.Stock exchange market HUD. — Stock Video
Animation of statistics processing over sky with clouds. global data processing and digital interface concept digitally generated video.
Animation Statistics Processing Sky Clouds Global Data Processing Digital Interface — Stock Video
MRI scan on computer monitor
MRI scan — Stock Video

Usage Information

You can use this royalty-free vector image "Business candle stick graph chart of stock market investment trading, Bullish point, Bearish point. trend of graph vector design." for personal and commercial purposes according to the Standard or Extended License. The Standard License covers most use cases, including advertising, UI designs, and product packaging, and allows up to 500,000 print copies. The Extended License permits all use cases under the Standard License with unlimited print rights and allows you to use the downloaded vector files for merchandise, product resale, or free distribution.

This stock vector image is scalable to any size. You can buy and download it in high resolution up to 7824x4204. Upload Date: Aug 12, 2020