Causes, risks and adaptation strategies for sea level rising — Stock Vector

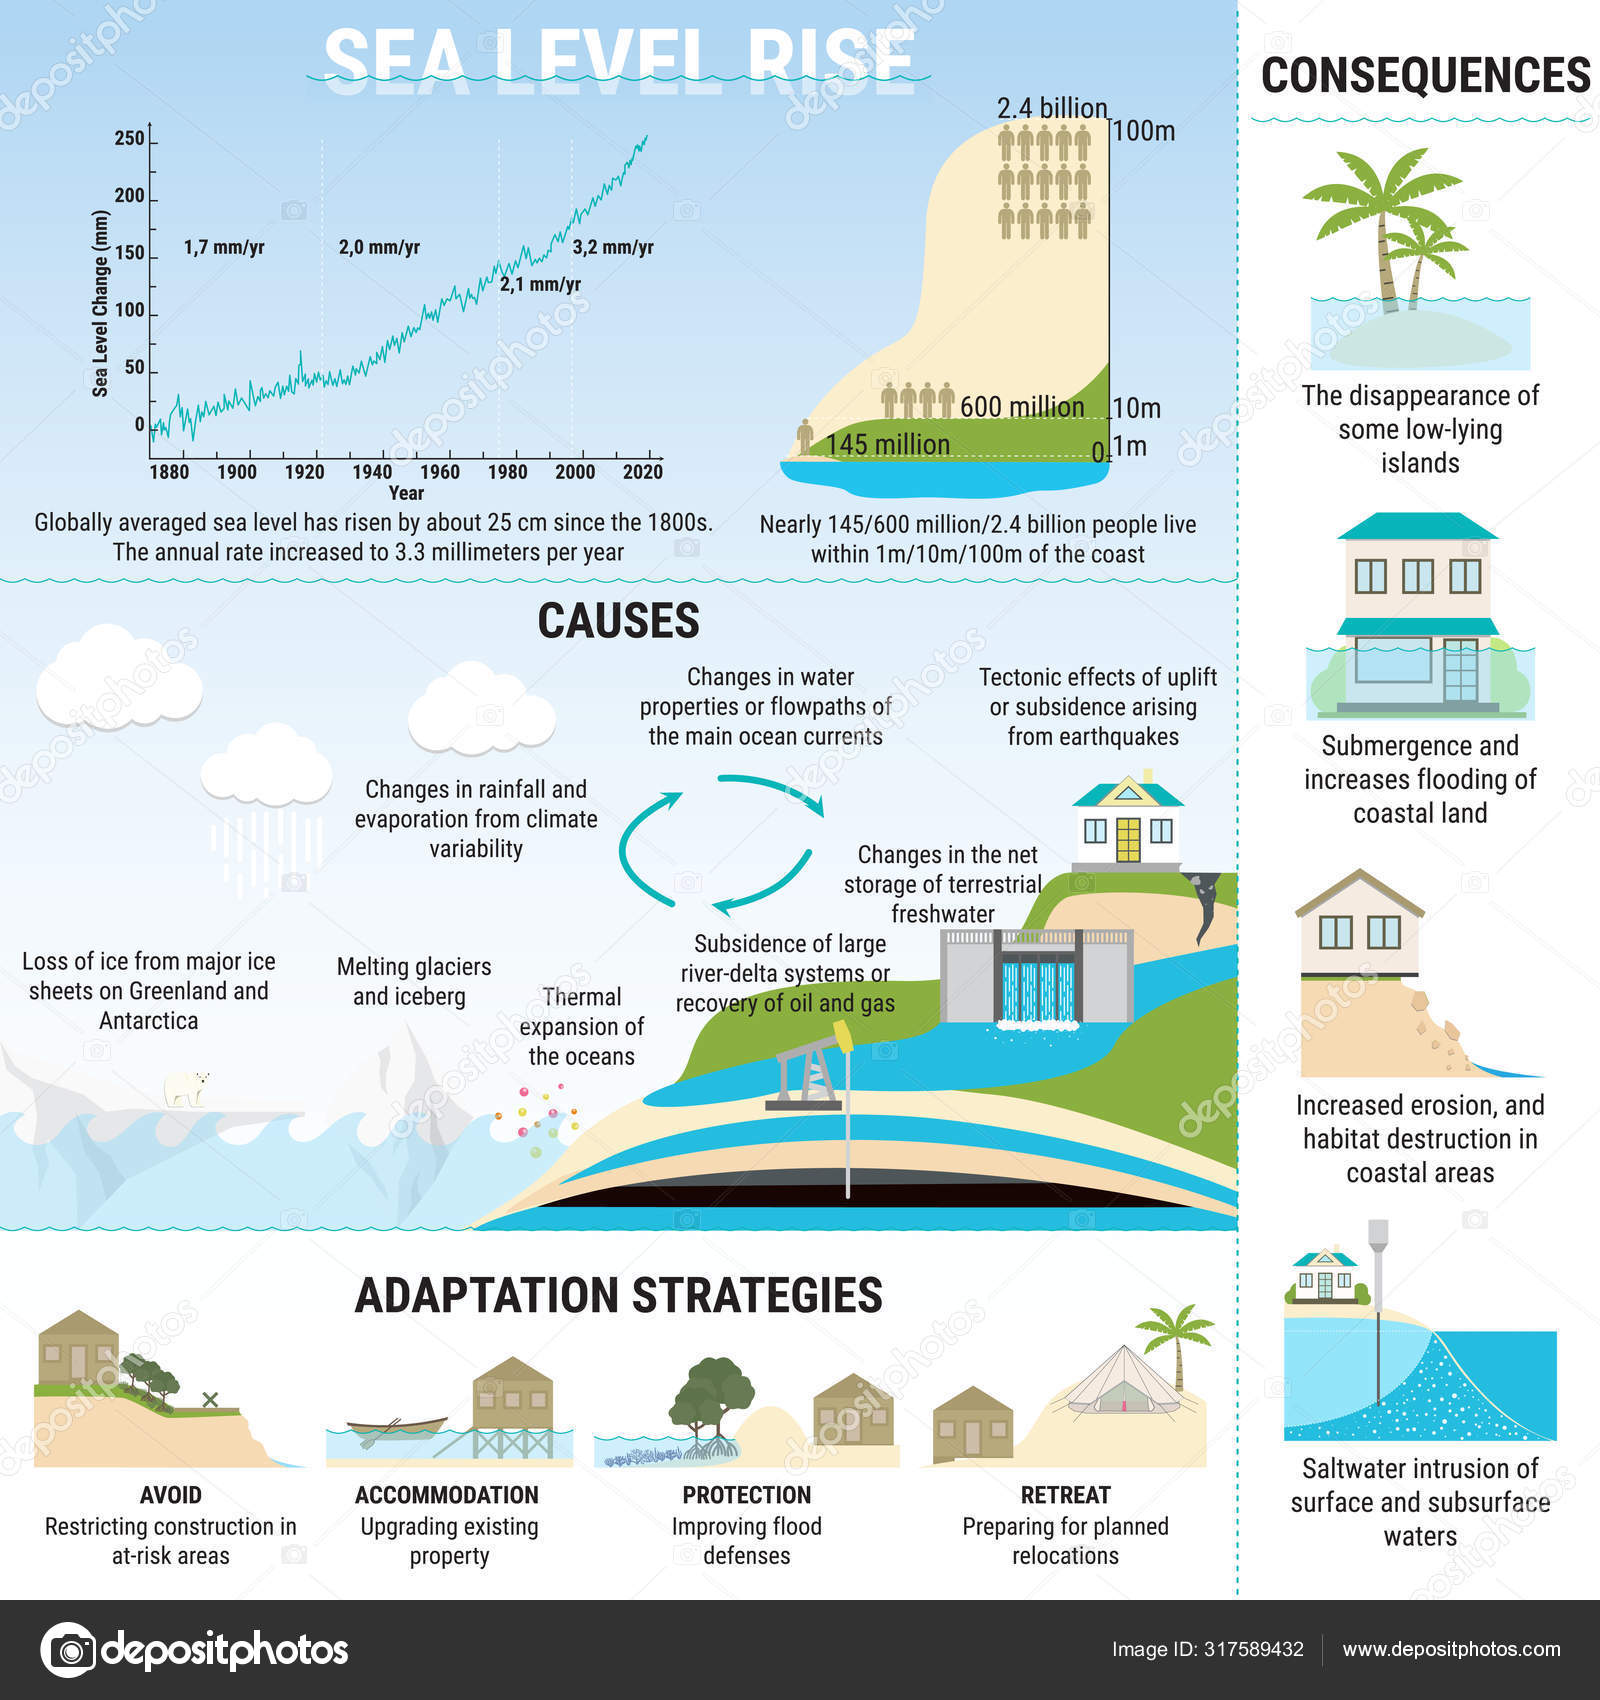
Causes, risks and adaptation strategies for sea level rising — Vector

Sea Level Rise infographic. Causes, risks, consequences and adaptation strategies for sea level rising. Water pollution. Global warming and climate change vector concept.

 — Vector by m.malinika

Same Series:

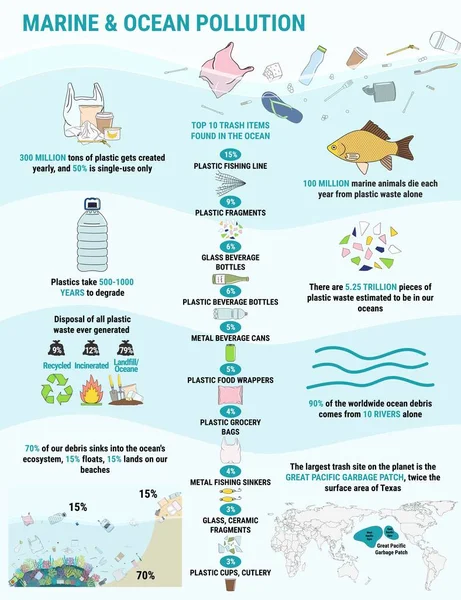
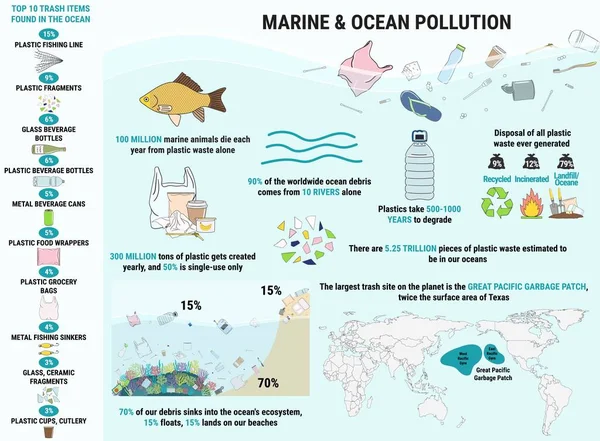
Trash items found littering in the ocean. Marine, Ocean, coastal pollution. Waste infographic. Global environmental problems. Save the ocean concept. Hand drawn vector illustration.
Trash Items Found Littering Ocean Marine Ocean Coastal Pollution Waste — Stock Vector
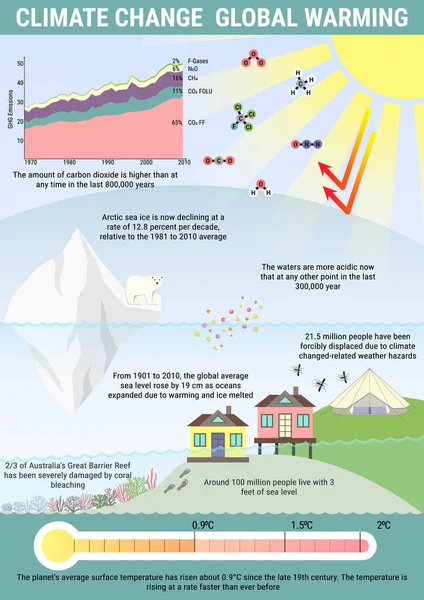
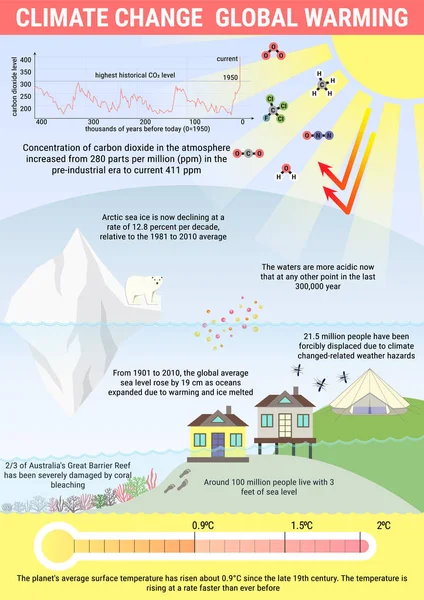
Global warming and climat change vector infographics. Greenhouse effect and sea level rise in flat style.
Global warming and climat change vector infographics — Stock Vector
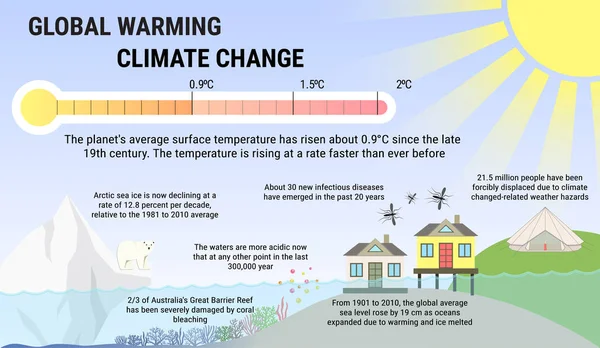
Global warming and climat change vector infographics. Greenhouse effect and sea level rise in flat style.
Global warming and climat change vector infographics — Stock Photo, Image
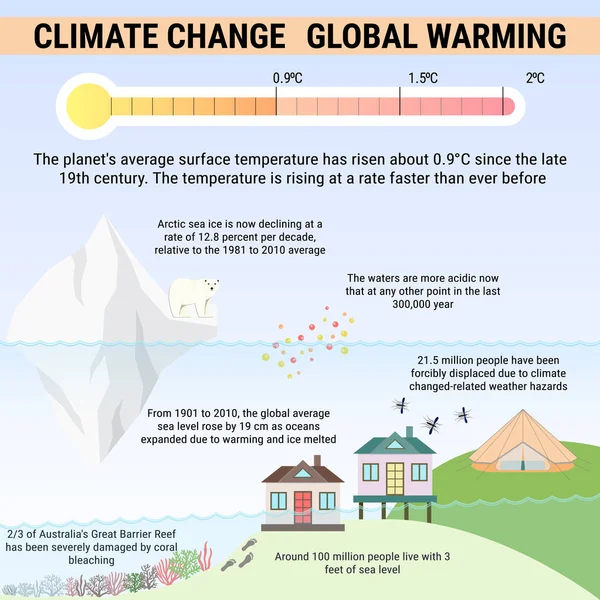
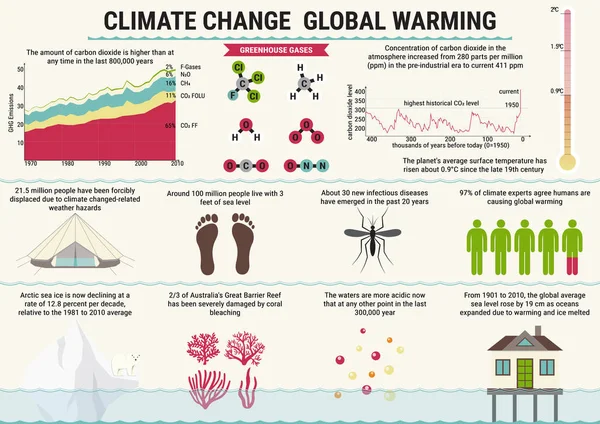
Global warming and climat change vector infographics. Greenhouse effect and sea level rise in flat style.
Global warming and climat change vector infographics — Stock Photo, Image
Trash items found littering in the ocean. Marine, Ocean, coastal pollution. Waste infographic. Global environmental problems. Save the ocean concept. Hand drawn vector illustration.
Trash Items Found Littering Ocean Marine Ocean Coastal Pollution Waste — Stock Vector
The greenhouse effect illustration infographic. Global greenhouse gases emission. Carbon dioxide and methane emission. Global warming, climate change infographic.
The greenhouse effect illustration and carbon dioxide emission — Stock Vector
Global warming and climat change vector infographics. Greenhouse effect and sea level rise in flat style.
Global warming and climat change vector infographics — Stock Photo, Image
Global warming and climat change vector infographics. Greenhouse effect and sea level rise in flat style.
Global warming and climat change vector infographics — Stock Photo, Image
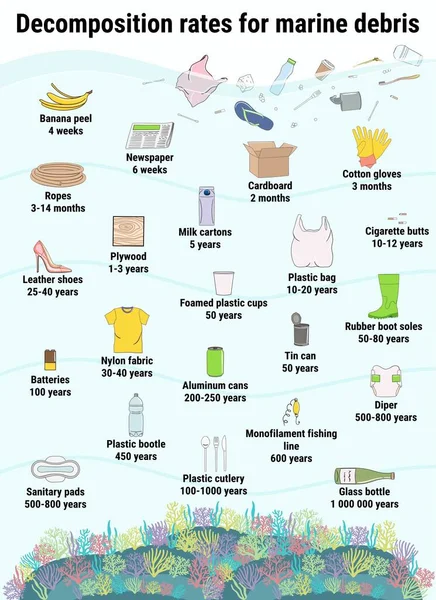
Decomposition rates for marine debris. How long does it take to decompose. Marine, Ocean, coastal pollution. Waste infographic. Global environmental problems. Hand drawn vector illustration.
Decomposition Rates Marine Debris How Long Does Take Decompose Marine — Stock Vector
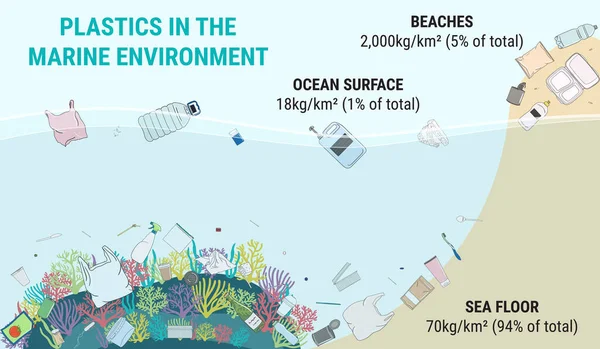
Infographic of plastics in the marine environment. Ocean plastic pollution. Environmental problems. Hand drawn vector illustration.
Infographic Plastics Marine Environment Ocean Plastic Pollution Environmental Problems Hand — Stock Vector
Waste composition by income level infographic. Low, lower-middle, upper-middle, high income. Different types of rubbish. Waste management. Organic, metal, plastic, paper, glass garbage.
Waste Composition Income Level Infographic Low Lower Middle Upper Middle — Stock Vector
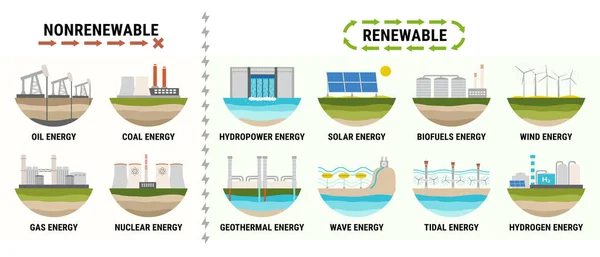
Infographic of energy consumption by source. Nonrenewable energy like oil, gas, coal, nuclear. Renewable energy sources like hydropower, solar, wind and geothermal. Electricity generation flat vector
Infographic Energy Consumption Source Nonrenewable Energy Oil Gas Coal Nuclear — Stock Vector
Global greenhouse gases emission and their characteristics. Greenhouse effect. The largest emitting countries. Carbon dioxide and methane emission. Global warming, climate change infographic.
Global greenhouse gases emission and their characteristics — Stock Vector
Infographic of global methane emissions by countries. Greenhouse gas emissions by economic sector. Ecological environment pollution. Global warming, climate change vector infographic.
Infographic of global methane emissions by countries — Stock Vector
Waste infographic. Sorting garbage, segregation and recycling infographics. Recycle trash bins and different types of rubbish. Garbage pollution. Waste management. Hand drawn vector illustration.
Waste Infographic Sorting Garbage Segregation Recycling Infographics Recycle Trash Bins — Stock Vector
Infographic of global nitrous oxide emissions by countries. Greenhouse gas emissions by economic sector. Ecological environment pollution. Global warming, climate change vector infographic.
Infographic of global nitrous oxide emissions by countries — Stock Vector

Usage Information

You can use this royalty-free vector image "Causes, risks and adaptation strategies for sea level rising" for personal and commercial purposes according to the Standard or Extended License. The Standard License covers most use cases, including advertising, UI designs, and product packaging, and allows up to 500,000 print copies. The Extended License permits all use cases under the Standard License with unlimited print rights and allows you to use the downloaded vector files for merchandise, product resale, or free distribution.

This stock vector image is scalable to any size. You can buy and download it in high resolution up to 5000x5000. Upload Date: Nov 5, 2019