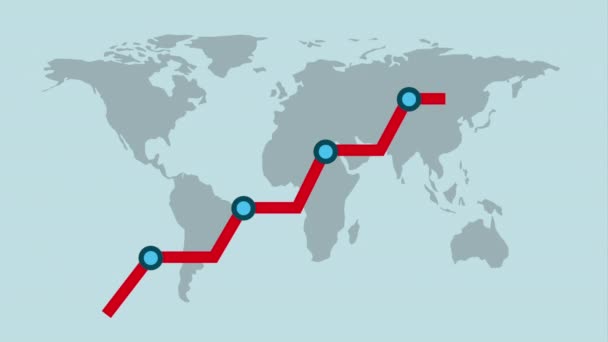
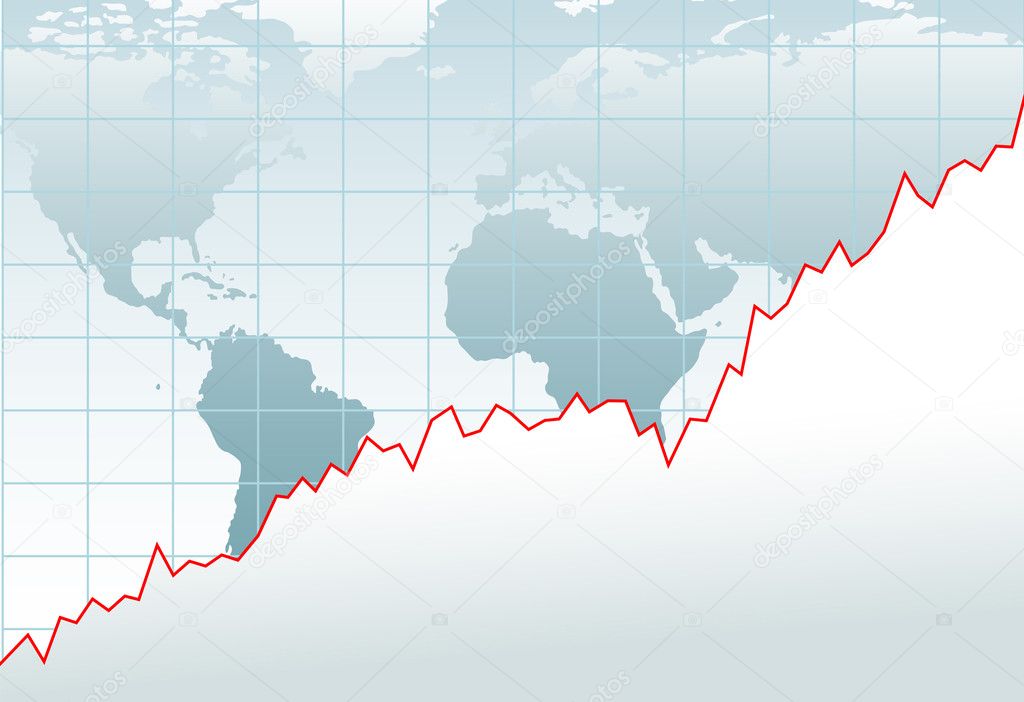
Chart global economy financial growth map — Stock Vector

Chart global economy financial growth map — Vector

Chart of growth of global financial economy or company on a world map

 — Vector by michaeldb

Similar Stock Videos:

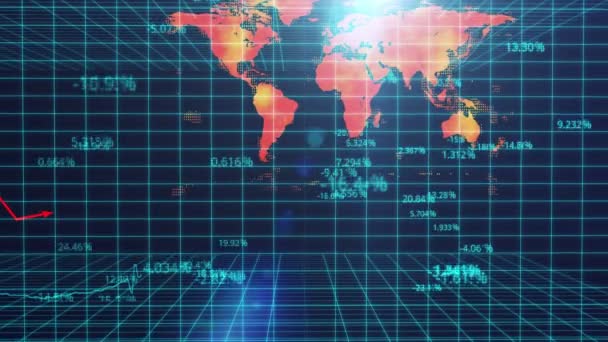
Animation of financial data processing over world map on black background. global finance, business and digital interface concept digitally generated video.
Animation Financial Data Processing World Map Black Background Global Finance — Stock Video
Stock charts market trading. Seamless loop candlestick graph with world map. Screen with a stock business chart.
Chart stock market online trading concept — Stock Video
Silhouetted of Business
Silhouetted of Business — Stock Video
Forex stock market chart and holographic earth map on background - new quality financial business animated dynamic motion video footage
Forex stock market chart and holographic earth map on background - new quality financial business animated dynamic motion video footage — Stock Video
Animation of graph over data processing world map and covid-19 text on black background. global covid 19 pandemic concept digitally generated video.
Animation Graph Data Processing World Map Covid Text Black Background — Stock Video
Line growth design, Video Animation
Line growth design — Stock Video
Digital composite of spinning globe against dashboard of financial data on blue background
Digital Composite Spinning Globe Dashboard Financial Data Blue Background — Stock Video
Electronic chart with stock market fluctuations
Stock market graphs monitoring fluctuations, world financial situation, stats — Stock Video
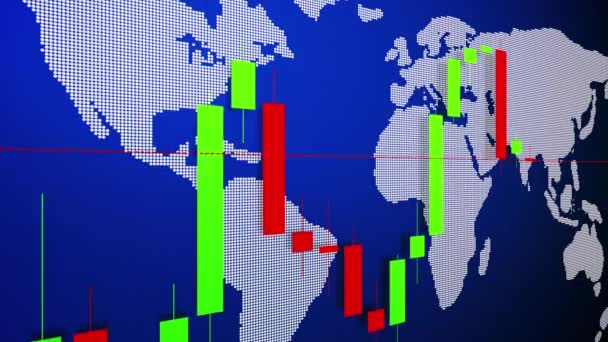
Stock market charts with dot world map. Seamlessly loop animaion. Candlestick graph of exchange market. 16-bit depth
Stock market charts with dot world map — Stock Video
Stock market charts. Seamlessly loop currency graph, online quotes of stock exchange market, with world map.
Stock market charts and world map in background — Stock Video
Business candle stick graph of stock market chart investment trading. Downtrend of stocks on world exchanges. the concept of recession and global economic crisis
Business Candle Stick Graph Stock Market Chart Investment Trading Downtrend — Stock Video
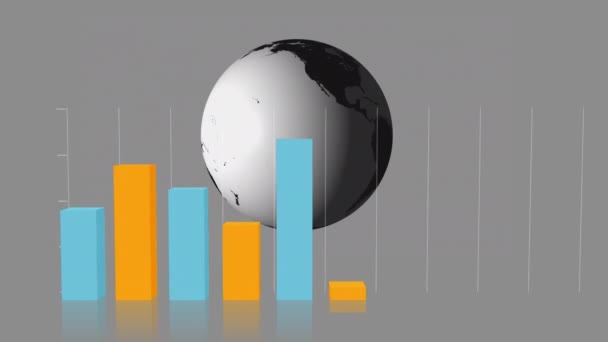
Animation of blue and yellow graphs and globe spinning on gray background
Animation Blue Yellow Graphs Globe Spinning Gray Background — Stock Video
Computer generated presentation of global market review, statistical analysis
Computer generated presentation of global market review, statistical analysis — Stock Video
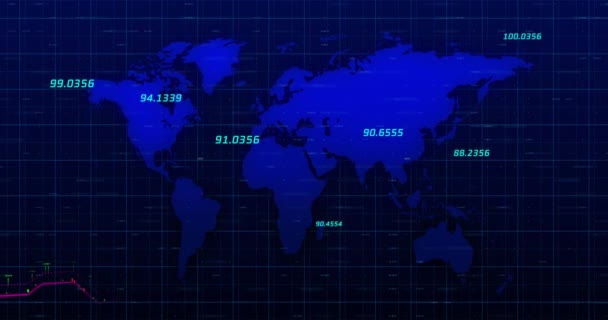
Animation of numbers changing and data processing with world map. global data processing and digital interface concept digitally generated video.
Animation Numbers Changing Data Processing World Map Global Data Processing — Stock Video
Electronic chart with Great Britain currency fluctuations after the Brexit vote
British pound falling compared to US dollar, financial crisis, unstable economy — Stock Video
Statistical data processing over spinning globe against warehouse in background. global finance and business concept
Statistical Data Processing Spinning Globe Warehouse Background Global Finance Business — Stock Video
Stock charts seamlessly looped animation 16-bit depth. Candlestick stock market chart with a dots world map in the background
Candlestick chart with world map in background — Stock Video

Usage Information

You can use this royalty-free vector image "Chart global economy financial growth map" for personal and commercial purposes according to the Standard or Extended License. The Standard License covers most use cases, including advertising, UI designs, and product packaging, and allows up to 500,000 print copies. The Extended License permits all use cases under the Standard License with unlimited print rights and allows you to use the downloaded vector files for merchandise, product resale, or free distribution.

This stock vector image is scalable to any size. You can buy and download it in high resolution up to 4229x2900. Upload Date: Nov 5, 2011