Electromagnetic Waves: Radio Wave Spectrum. Vector illustration diagram with wavelength, frequency, harmfulness and wave structure. — Stock Vector

Electromagnetic Waves: Radio Wave Spectrum. Vector illustration diagram with wavelength, frequency, harmfulness and wave structure. — Vector

Electromagnetic Waves: Radio Wave Spectrum. Vector illustration diagram with wavelength, frequency, harmfulness and wave structure. Science educational information. Info poster.

 — Vector by VectorMine

Same Series:

Amplitude and pitch vector illustration. Labeled educational quiet or loud sound scheme. Compared low and high frequency impact on tune resonance. Explanation diagram as basic physics handout brochure
Amplitude and pitch vector illustration. Labeled educational sound scheme. — Stock Vector
Doppler effect vector illustration. Labeled educational physical sound and light scheme. Educational explanation why waves frequency changes in motion. Stationary static source and moving difference.
Doppler effect vector illustration. Labeled educational sound, light graph. — Stock Vector
Decibel scale chart vector illustration. Measuring noise pollution levels for work safety normative and healthy urban environment. Educational max and min volume amplitude threshold examples diagram.
Decibel scale chart vector illustration — Stock Vector
Universe illustrated infographic, vector objects and elements collection,futuristic HUD design. All solar system and cosmic objects like - asteroids, comets, galaxy, black hole, red giants and stars.
Universe illustrated infographic, vector elements design collection. All solar system and cosmic objects. Big bang stages. Human male and female visualizations. — Stock Vector
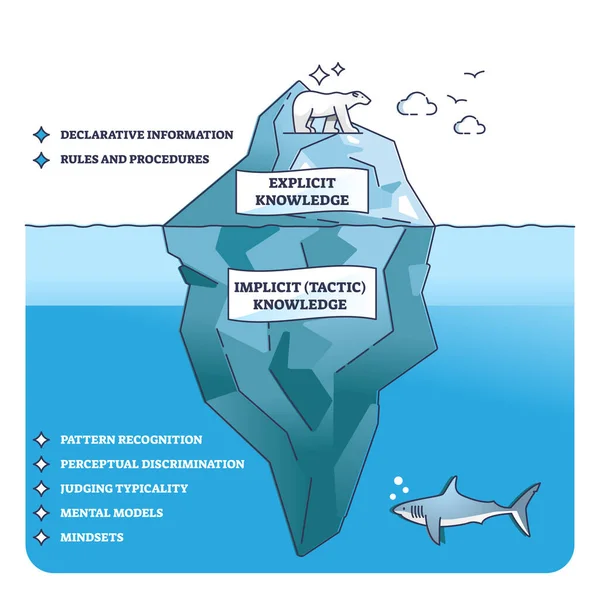
Tactic knowledge with explicit and implicit experience outline diagram. Labeled educational scheme with personal information management and mindset source vector illustration. Invisible intuition.
Tactic Knowledge Explicit Implicit Experience Outline Diagram Labeled Educational Scheme — Stock Vector
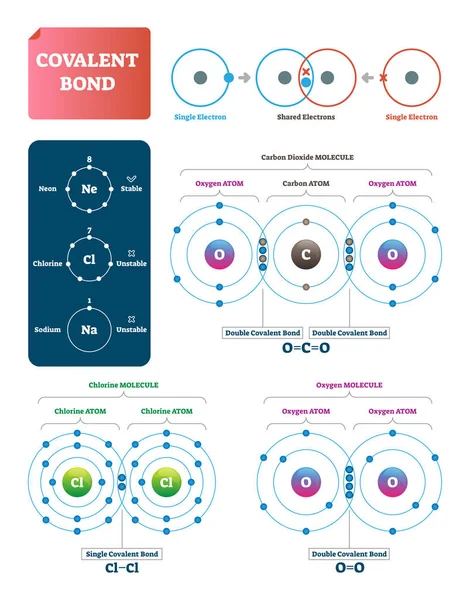
Covalent bond vector illustration. Process explanation labeled diagram. Molecular bond with single and shared electrons. Carbon dioxide, chlorine and oxygen examples with structure and double pairs.
Covalent bond vector illustration. Explanation and example labeled diagram. — Stock Vector
Geology vector illustration. Flat tiny volcano earthquake persons concept. Signal technology study to predict nature disasters. Scientists gathering instrument data. Seismic activity and lava eruption
Geology vector illustration. Flat tiny volcano earthquake persons concept. — Stock Vector
Ocean depth zones infographic, vector illustration labeled diagram. Oceanography science educational graphic information. Depth at which sperm whales live and deepest point reached by human.
Ocean depth zones infographic, vector illustration labeled diagram — Stock Vector
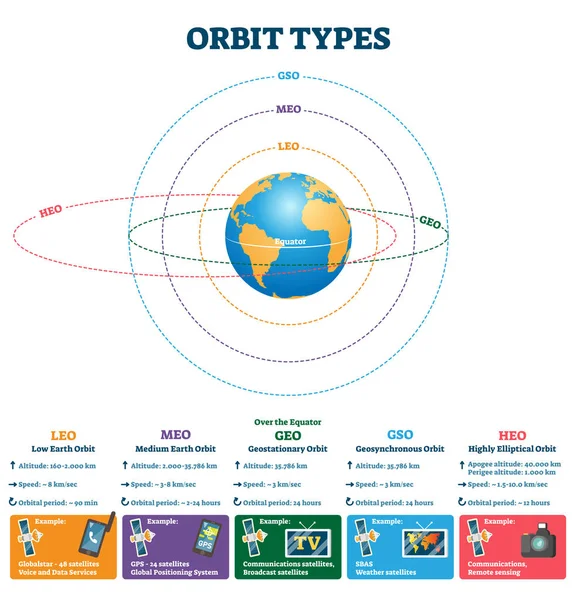
Orbit types vector illustration. Labeled educational scheme with satellites altitude, speed and orbital period. GSO, MEO, LEO, HEO and GEO explanation description. Earth broadcast signal comparison.
Orbit types vector illustration. Labeled satellites altitude, speed scheme. — Stock Vector
Types of forces vector illustration collection. Example drawings of contact and non-contact force type. Illustrated cartoon clip art elements. Educational school physics study guide to learn science.
Types of forces vector illustration example collection — Stock Vector
Stratified sampling example, vector illustration diagram. Research method explanation scheme with person symbols and stages. Population groups called strata and picking random sample from each group.
Stratified sampling example, vector illustration diagram — Stock Vector
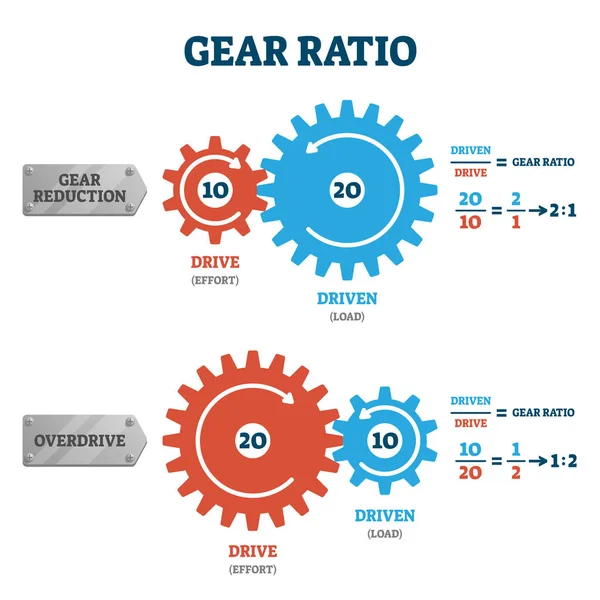
Gear ratio vector illustration. Labeled physical power formula explanation scheme. Educational bike teeth force transmission . Mechanical reduction or overdrive example graphic with mathematical proof
Gear ratio vector illustration. Labeled physical formula explanation scheme — Stock Vector
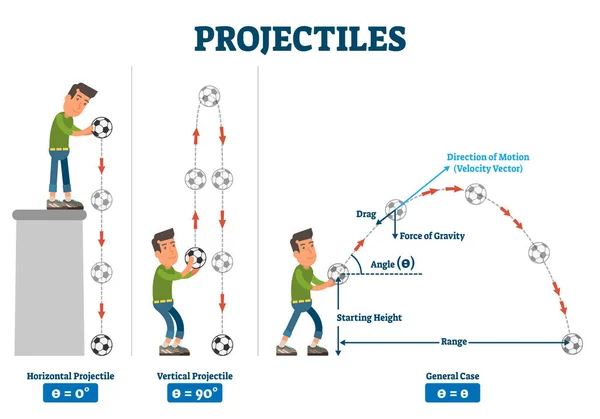
Projectiles vector illustration. Labeled physical force trajectory scheme. Diagram with horizontal and vertical case examples comparison. Drag, angle, velocity and gravity power mathematical formula.
Projectiles vector illustration. Labeled physical force trajectory scheme. — Stock Vector
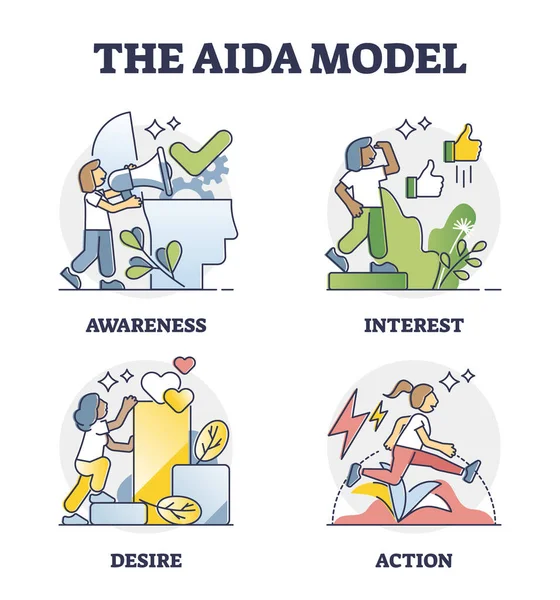
The AIDA model as customer behavior levels explanation outline diagram. Awareness, interest, desire and action as basic decision making steps for purchase vector illustration. Educational explanation.
The AIDA model as customer sale behavior levels explanation outline diagram — Stock Vector
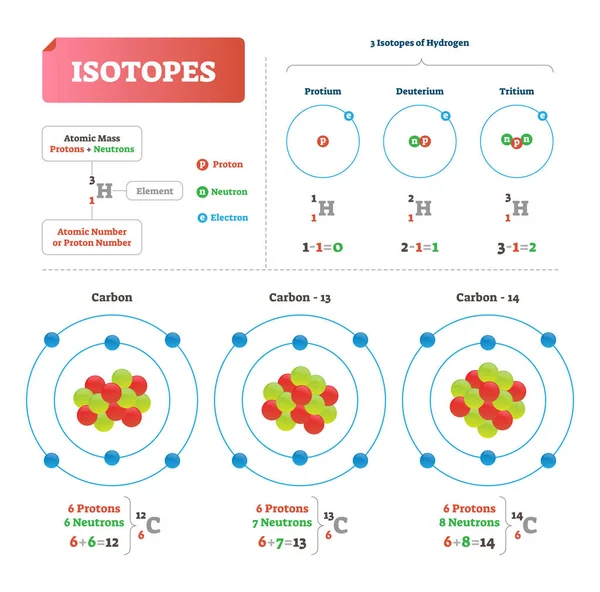
Isotope vector illustration. Labeled scheme with hydrogen particles. Explanation diagram with carbon protons and electrons. Variants of a particular chemical element which differ in neutron numbers.
Isotope vector illustration. Labeled scheme with hydrogen atomic neutrons. — Stock Vector
Rotation vs revolution vector illustration. Labeled earth movement system explanation scheme. Educational day, night and seasons diagram. Circulation round process example with weather change pattern.
Rotation vs revolution vector illustration. Labeled earth movement scheme. — Stock Vector

Similar Stock Videos:

Collection of infographic elements in the popular line style.
Infographic Elements In The Line Style. Yellow Spot — Stock Video
Corporate infographic elements bundle. Can be used for workflow, startup, business success, diagram, presentation, banner, teamwork, design, infographic elements set information infographics
Corporate Infographic Elements — Stock Video
Blue corporate infographic elements bundle. Can be used for workflow, startup, business success, diagram, presentation, banner, teamwork, design, infographic elements, set information infographics
Blue Corporate Infographic Elements — Stock Video
Blue corporate infographic elements bundle. Can be used for workflow, startup, business success, diagram, presentation, banner, teamwork, design, infographic elements, set information infographics
Blue Corporate Infographic Elements — Stock Video
Colorful corporate infographic elements bundle. Can be used for workflow, startup, business success, diagram, presentation, banner, teamwork, design, infographic elements set information infographics
Colorful Corporate Infographic Elements — Stock Video
Colorful corporate infographic elements bundle. Can be used for workflow, startup, business success, diagram, presentation, banner, teamwork, design, infographic elements set information infographics
Colorful Corporate Infographic Elements — Stock Video
Corporate infographic elements bundle. Can be used for workflow, startup, business success, diagram, presentation, banner, teamwork, design, infographic elements set information infographics
Corporate Infographic Elements — Stock Video
Corporate infographic elements bundle. Can be used for workflow, startup, business success, diagram, presentation, banner, teamwork, design, infographic elements set information infographics
Corporate Infographic Elements — Stock Video
Blue corporate infographic elements bundle. Can be used for workflow, startup, business success, diagram, presentation, banner, teamwork, design, infographic elements, set information infographics
Blue Corporate Infographic Elements — Stock Video
Colorful corporate infographic elements bundle. Can be used for workflow, startup, business success, diagram, presentation, banner, teamwork, design, infographic elements set information infographics
Colorful Corporate Infographic Elements — Stock Video
Blue corporate infographic elements bundle. Can be used for workflow, startup, business success, diagram, presentation, banner, teamwork, design, infographic elements, set information infographics
Blue Corporate Infographic Elements — Stock Video
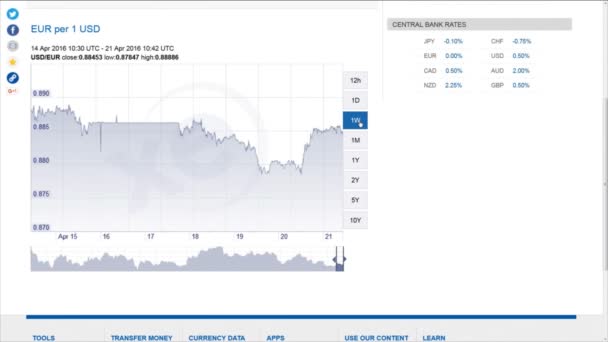
VILNIUS, LITHUANIA - APRIL 21, 2016: usd and eur currency exchange rate chart changes on webpage on April 21, 2016 in Vilnius, Lithuania.
Usd and eur currency exchange rate chart changes on webpage — Stock Video
Colorful corporate infographic elements bundle. Can be used for workflow, startup, business success, diagram, presentation, banner, teamwork, design, infographic elements set information infographics
Colorful Corporate Infographic Elements — Stock Video
Room for a custom logo in the upper left corner of the screen. Titles are of fictional shows.
Simulation of an on-screen interactive television guide menu from a cable or satellite company. — Stock Video

Usage Information

You can use this royalty-free vector image "Electromagnetic Waves: Radio Wave Spectrum. Vector illustration diagram with wavelength, frequency, harmfulness and wave structure." for personal and commercial purposes according to the Standard or Extended License. The Standard License covers most use cases, including advertising, UI designs, and product packaging, and allows up to 500,000 print copies. The Extended License permits all use cases under the Standard License with unlimited print rights and allows you to use the downloaded vector files for merchandise, product resale, or free distribution.

This stock vector image is scalable to any size. You can buy and download it in high resolution up to 4167x5339. Upload Date: Mar 14, 2018