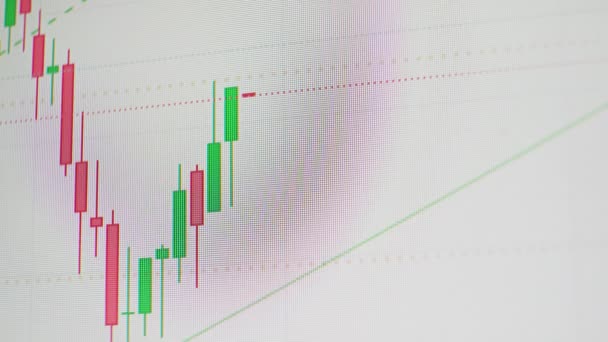
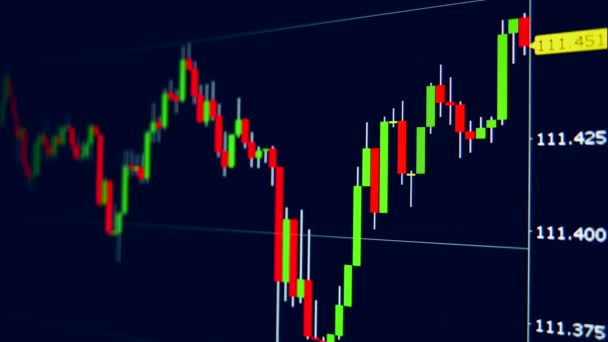
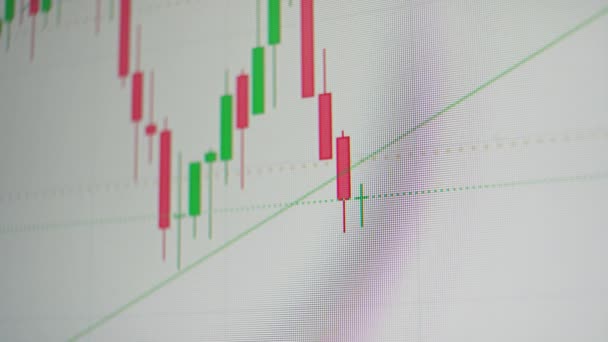
Financial Stock Market Graph Stock Market Investment Trading Bullish Point — Stock Vector

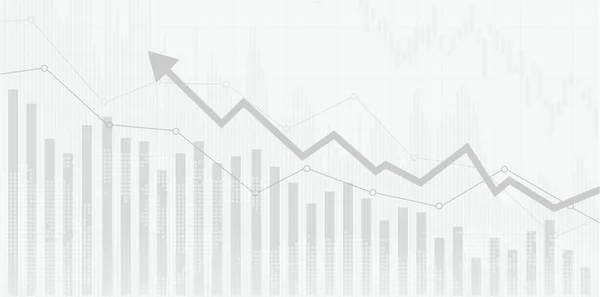
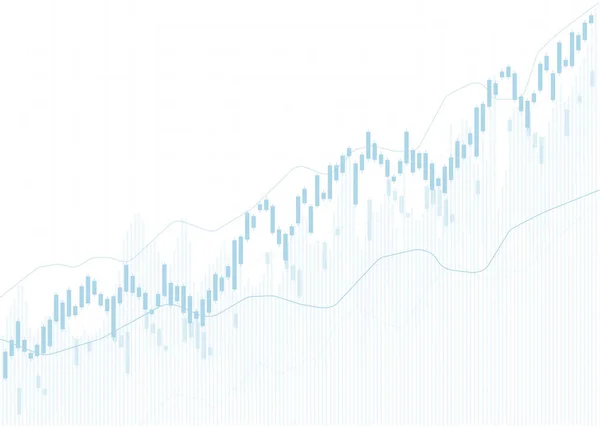
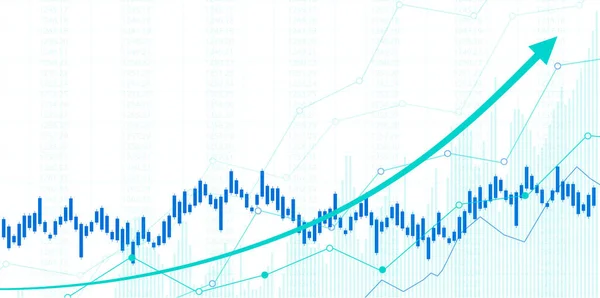
Financial stock market graph on stock market investment trading, Bullish point, Bearish point. trend of graph for business idea and all art work design. vector illustration. — Vector

Financial stock market graph on stock market investment trading, Bullish point, Bearish point. trend of graph for business idea and all art work design. vector illustration.

 — Vector by pondshutter@yahoo.com

Same Series:

Financial stock market graph on stock market investment trading, Bullish point, Bearish point. trend of graph for business idea and all art work design. vector illustration.
Financial Stock Market Graph Stock Market Investment Trading Bullish Point — Stock Vector
Financial stock market graph on stock market investment trading, Bullish point, Bearish point. trend of graph for business idea and all art work design. vector illustration.
Financial Stock Market Graph Stock Market Investment Trading Bullish Point — Stock Vector
Financial stock market graph on stock market investment trading, Bullish point, Bearish point. trend of graph for business idea and all art work design. vector illustration.
Financial Stock Market Graph Stock Market Investment Trading Bullish Point — Stock Vector
Financial stock market graph on stock market investment trading, Bullish point, Bearish point. trend of graph for business idea and all art work design. vector illustration
Financial Stock Market Graph Stock Market Investment Trading Bullish Point — Stock Vector
Stock market investment trading graph in graphic concept suitable for financial investment or Economic trends business idea. Vector design.
Stock Market Investment Trading Graph Graphic Concept Suitable Financial Investment — Stock Vector
Financial stock market graph on stock market investment trading, Bullish point, Bearish point. trend of graph for business idea and all art work design. vector illustration
Financial Stock Market Graph Stock Market Investment Trading Bullish Point — Stock Vector
Financial stock market graph on stock market investment trading, Bullish point, Bearish point. trend of graph for business idea and all art work design. vector illustration.
Financial Stock Market Graph Stock Market Investment Trading Bullish Point — Stock Vector
Business candle stick graph chart of stock market investment trading, Bullish point, Bearish point. trend of graph vector design.
Business Candle Stick Graph Chart Stock Market Investment Trading Bullish — Stock Vector
Stock market investment trading graph in graphic concept suitable for financial investment or Economic trends business idea. Vector design.
Stock Market Investment Trading Graph Graphic Concept Suitable Financial Investment — Stock Vector
Financial stock market graph on stock market investment trading, Bullish point, Bearish point. trend of graph for business idea and all art work design. vector illustration
Financial Stock Market Graph Stock Market Investment Trading Bullish Point — Stock Vector
Financial stock market graph on stock market investment trading, Bullish point, Bearish point. trend of graph for business idea and all art work design. vector illustration.
Financial Stock Market Graph Stock Market Investment Trading Bullish Point — Stock Vector
Financial stock market graph on stock market investment trading, Bullish point, Bearish point. trend of graph for business idea and all art work design. vector illustration
Financial Stock Market Graph Stock Market Investment Trading Bullish Point — Stock Vector
Financial stock market graph on stock market investment trading, Bullish point, Bearish point. trend of graph for business idea and all art work design. vector illustration
Financial Stock Market Graph Stock Market Investment Trading Bullish Point — Stock Vector
Financial stock market graph on stock market investment trading, Bullish point, Bearish point. trend of graph for business idea and all art work design. vector illustration.
Financial Stock Market Graph Stock Market Investment Trading Bullish Point — Stock Vector
Financial stock market graph on stock market investment trading, Bullish point, Bearish point. trend of graph for business idea and all art work design. vector illustration.
Financial Stock Market Graph Stock Market Investment Trading Bullish Point — Stock Vector
Candle stick graph chart of stock market investment trading, Bullish point, Bearish point. trend of graph vector design.
Candle Stick Graph Chart Stock Market Investment Trading Bullish Point — Stock Vector

Similar Stock Videos:

Universal stock market price chart on white background - new quality financial business animated dynamic motion video footage
Universal stock market price chart on white background - new quality financial business animated dynamic motion video footage — Stock Video
Candlestick Chart Movement Cryptocurrency on Monitor Screen PC. Stock Exchange. A trader analyzes a graph of cryptocurrency on a notebook, drives cursor on a grid diagram, up arrow. Stock market.
Candlestick Chart Movement Cryptocurrency on Monitor Screen PC. 4K. Close up — Stock Video
Stock graph or candlestick or Forex chart moving on blue background with table line. Business concept about financial, investment, risk, money trading. Hi resolution footage 4k 3840x2160
Stock Graph Candlestick Forex Chart Moving Blue Background Table Line — Stock Video
Stock graph or candlestick or Forex chart moving on blue background with table line. Business concept about financial, investment, risk, money trading. Hi resolution footage 4k 3840x2160
Stock Graph Candlestick Forex Chart Moving Blue Background Table Line — Stock Video
Stock market chart
Stock market chart — Stock Video
Stock price chart in the form of candles on a white background. Cranking. The view from the monitor screen.
Stock price chart in the form of candles on a white background. Cranking. The view from the monitor screen — Stock Video
Dynamic stock market graphs appearing on a display. 4K
Dynamic stock market graphs appearing on a display — Stock Video
Green and red chart columns show rising and falling of currency rate of exchange in stock trading app on gadget macro view
Green and red chart shows currency rate rising and falling — Stock Video
Universal stock market price chart on white background - new quality financial business animated dynamic motion video footage
Universal stock market price chart on white background - new quality financial business animated dynamic motion video footage — Stock Video
Stock exchange chart of the price of stocks, bonds indices or futures, on a computer monitor or scoreboard in a video of digital Japanese candlesticks. HD 4K 3840x2160
Trading on the stock exchange. Stock price chart. Trading — Stock Video
Dynamic graphs of stock prices on a screen. 4K
Dynamic graphs of stock prices on a screen — Stock Video
Trading index on a screen during spikes. 4K
Trading index on a screen during spikes. — Stock Video
Stock graph or candlestick or Forex chart trend slide on black background with table line. Business concept about financial, investment, risk, money trading. Hi resolution footage 4k 3840x2160
Stock Graph Candlestick Forex Chart Trend Slide Black Background Table — Stock Video
Universal stock market price chart on white background - new quality financial business animated dynamic motion video footage
Universal stock market price chart on white background - new quality financial business animated dynamic motion video footage — Stock Video
Display with real-time graphs of stock prices. 4K
Display with real-time graphs of stock prices — Stock Video
Stock exchange chart of the price of stocks, bonds indices or futures, on a computer monitor or scoreboard in a video of digital Japanese candlesticks. HD 4K 3840x2160
Trading. Trading on the stock exchange. Stock price chart — Stock Video
Universal stock market price chart on black background - new quality financial business animated dynamic motion video footage
Universal stock market price chart on black background - new quality financial business animated dynamic motion video footage — Stock Video
Business candlestick chart for investment trading in the stock market. Cryptocurrency chart, bitcoin online. Eth and btc quotes on the exchange. Bull market graphic abstract design trend.
Business Candlestick Chart for Investment Trading in the Stock Market — Stock Video

Usage Information

You can use this royalty-free vector image "Financial stock market graph on stock market investment trading, Bullish point, Bearish point. trend of graph for business idea and all art work design. vector illustration." for personal and commercial purposes according to the Standard or Extended License. The Standard License covers most use cases, including advertising, UI designs, and product packaging, and allows up to 500,000 print copies. The Extended License permits all use cases under the Standard License with unlimited print rights and allows you to use the downloaded vector files for merchandise, product resale, or free distribution.

This stock vector image is scalable to any size. You can buy and download it in high resolution up to 7952x4972. Upload Date: Mar 27, 2020