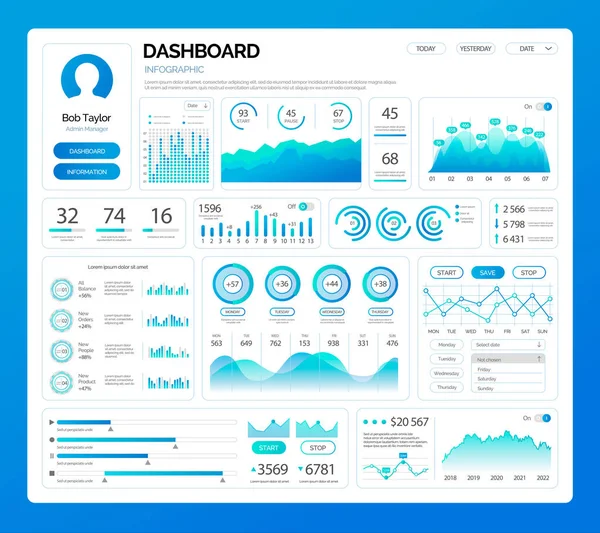
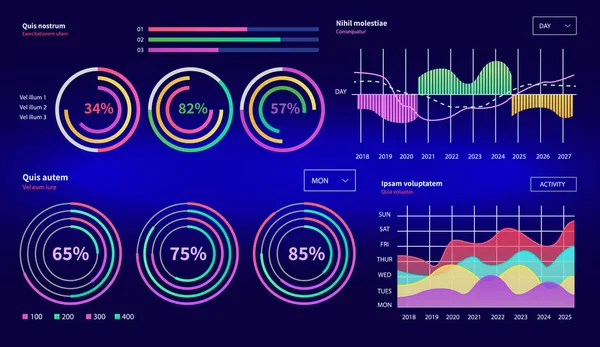
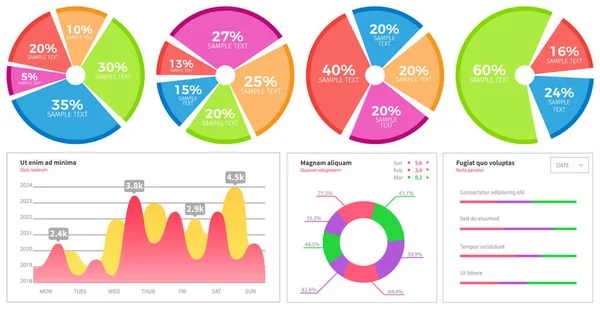
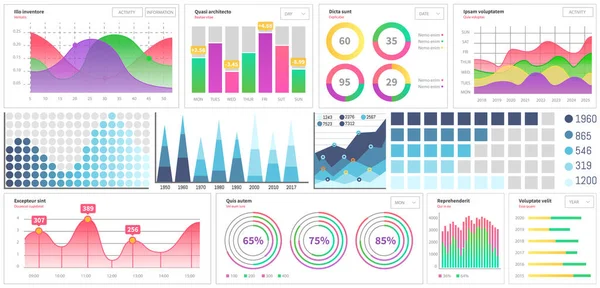
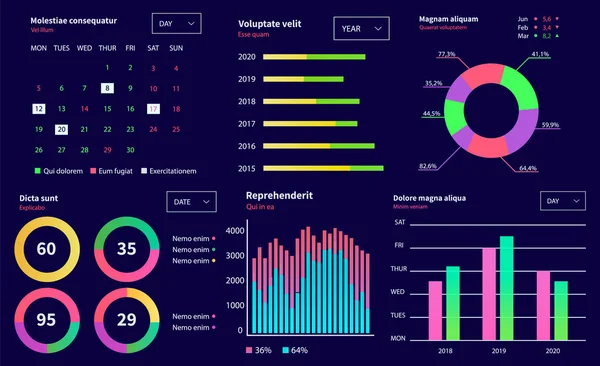
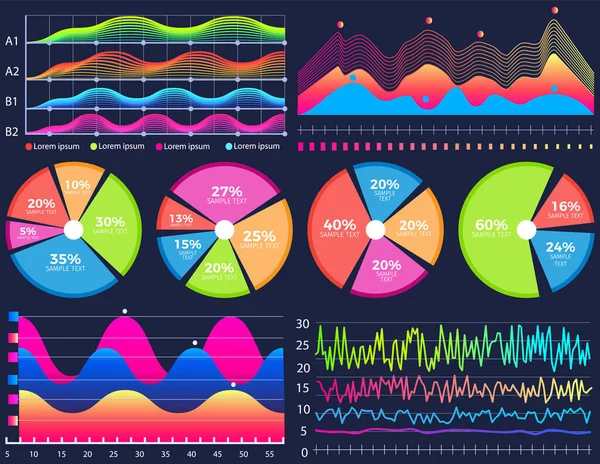
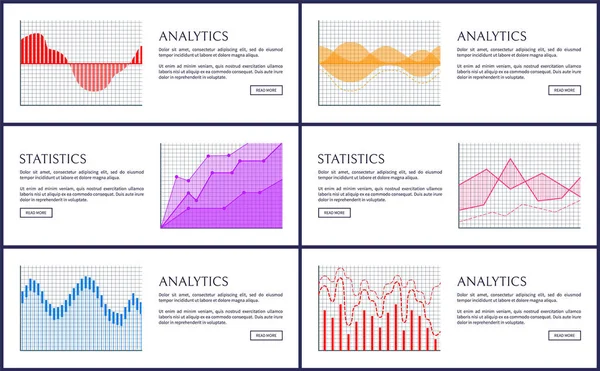
Infographic Dashboard Admin Panel Vector Illustrarion Diagram Illustrated Complex Relationship — Stock Vector

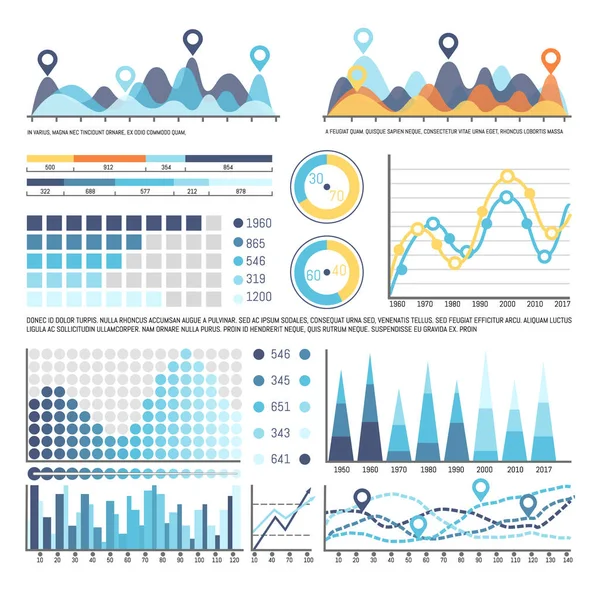
Infographic dashboard. Admin panel. Vector illustrarion The diagram illustrated complex relationship between variables The statistics indicated significant increase in sales The chart displayed market — Vector

Infographic dashboard. Admin panel. Vector illustrarion The diagram illustrated complex relationship between variables The statistics indicated significant increase in sales The chart displayed market

 — Vector by robuart

Same Series:

Dashboard infographics on profile of person user vector. Information analysis for business, data in visual representation. Info charts schemes diagrams
Dashboard Infographics on Profile of Person User — Stock Vector
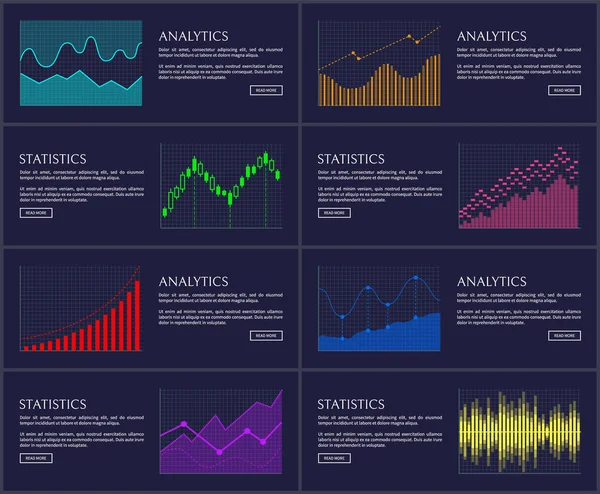
Statistics visual presentation with text set headlines, buttons and charts, stat and analytics collection vector illustration isolated on blue
Statistics Visual Presentation Vector Illustration — Stock Vector
Intelligent technology hud interactive panel. Data screen with charts, diagrams. Futuristic ui infographics on dark background. Diagram lines color chart, graph presentation. Annual financial report
Intelligent technology hud interactive panel. Data screen with charts. Annual financial report — Stock Vector
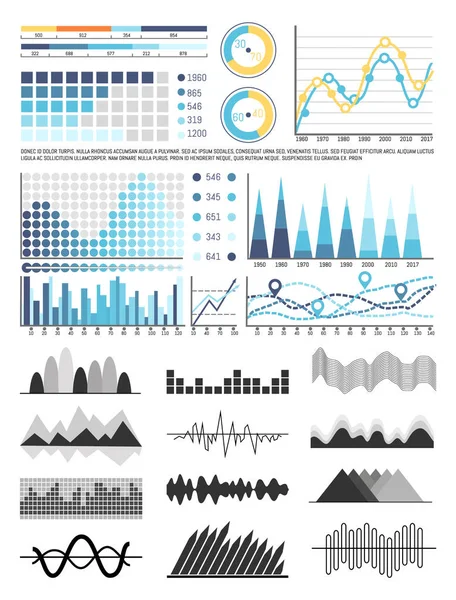
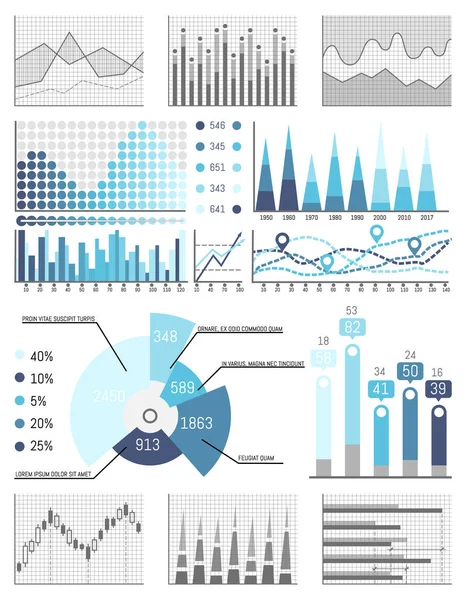
Graphics and flowcharts, schemes and charts set vector. Monochrome sketches outline of infocharts and infographics. Pie diagrams and numbers figures
Graphics and Flowcharts, Schemes and Charts Set — Stock Vector
Infographic chart vector template. Annual statistics curve graph design. Market data diagrams. Graphic information visualization and analysis. Statistical indicators and frequency of data changes
Infographic Chart Vector Template Annual Statistics Curve Graph Design Market — Stock Vector
Infographic chart vector template. Annual statistics curve graph design. Market data diagrams. Graphic information visualization and analysis. Statistical indicators and frequency of data changes
Market diagrams. Graphic information visualization and analysis. Statistical indicators and data — Stock Vector
Infographic chart vector template. Annual statistics curve graph design. Market data diagrams. Graphic information visualization and analysis. Statistical indicators and frequency of data changes
Infographic Chart Vector Template Annual Statistics Curve Graph Design Market — Stock Vector
Infographic chart vector template. Annual statistics curve graph design. Market data diagrams. Graphic information visualization and analysis. Statistical indicators and frequency of data changes
Market diagrams. Graphic information visualization and analysis. Statistical indicators and data — Stock Vector
Intelligent technology hud interactive panel. Data screen with charts, diagrams. Futuristic ui infographics on dark background. Diagram lines color chart, graph presentation. Annual financial report
Intelligent Technology Hud Interactive Panel Data Screen Charts Diagrams Futuristic — Stock Vector
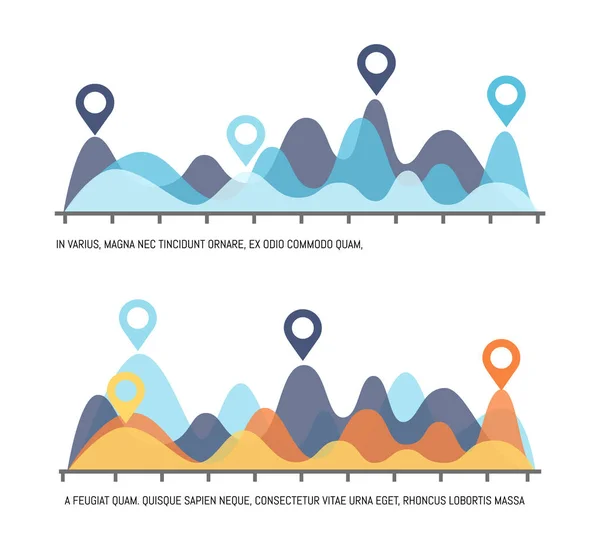
Infographic visualization of results of research vector. Location pointers on flowcharts layout, info chart with scale text sample explanation of data
Infographic Visualization of Results of Research — Stock Vector
Intelligent technology hud interactive panel. Data screen with charts, diagrams. Futuristic ui infographics on dark background. Diagram lines color chart, graph presentation. Annual financial report
Intelligent technology hud interactive panel. Data screen with charts. Annual financial report — Stock Vector
Business data flowcharts visual info presentation vector. Strategy planning, results of investigation, detailed explanation of graphs and infographics
Business,  Data Flowcharts Visual Info Presentation — Stock Vector
Infographic chart vector template. Annual statistics curve graph design. Market data diagrams. Graphic information visualization and analysis. Statistical indicators and frequency of data changes
Market diagrams. Graphic information visualization and analysis. Statistical indicators and data — Stock Vector
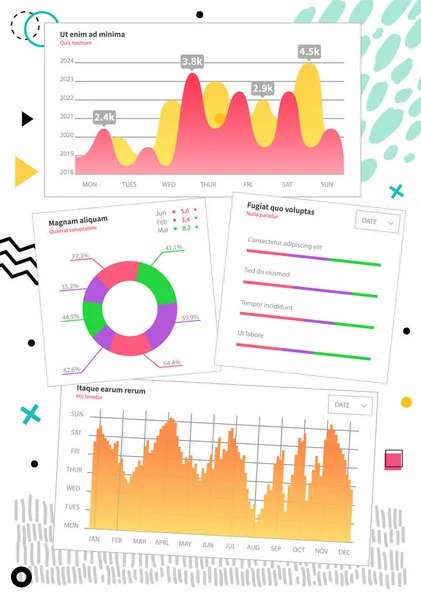
Statistics and analytics infographics, vector card, colorful charts, helpful economy data, growing diagrams, text sample, illustration with charts set
Statistics and Analytics Infographics, Vector Card — Stock Vector
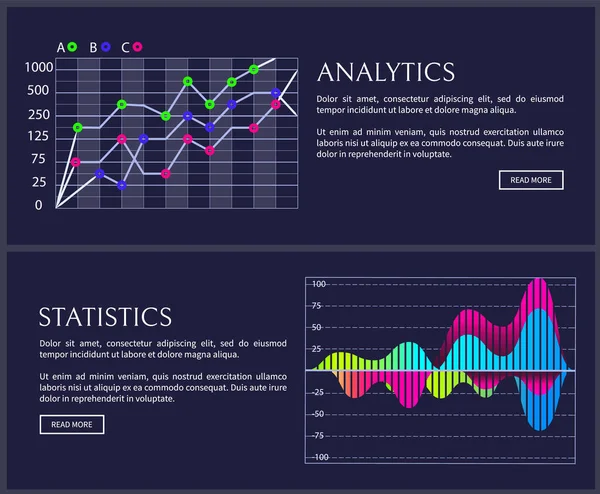
Statistics and analytics banner information charts, vector illustration isolated on dark backdrop, colorful charts set, triangles and curved lines
Statistics and Analytics Banner Information Charts — Stock Vector
Infographic with timeline and numbers information vector. Schemes with percentage on pie diagram, charts with pointer and location signs, flowcharts
Infographic with Timeline and Numbers Information — Stock Vector

Usage Information

You can use this royalty-free vector image "Infographic dashboard. Admin panel. Vector illustrarion The diagram illustrated complex relationship between variables The statistics indicated significant increase in sales The chart displayed market" for personal and commercial purposes according to the Standard or Extended License. The Standard License covers most use cases, including advertising, UI designs, and product packaging, and allows up to 500,000 print copies. The Extended License permits all use cases under the Standard License with unlimited print rights and allows you to use the downloaded vector files for merchandise, product resale, or free distribution.

This stock vector image is scalable to any size. You can buy and download it in high resolution up to 5882x3000. Upload Date: Nov 7, 2023