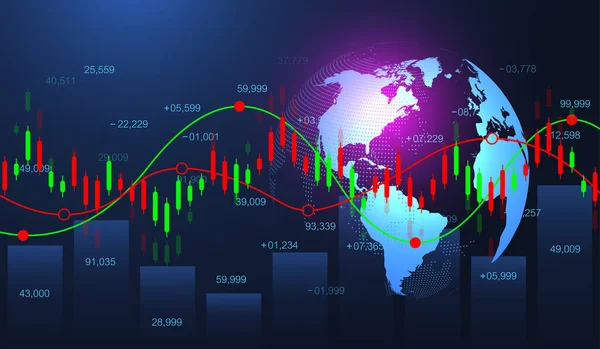
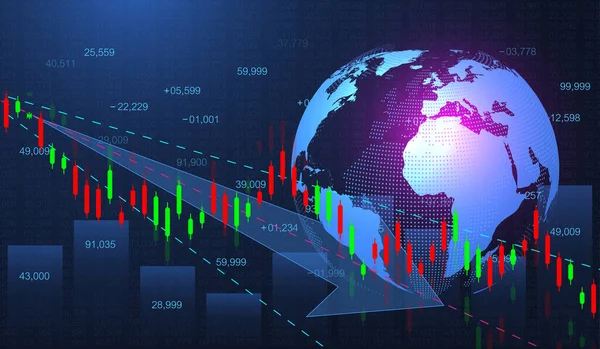
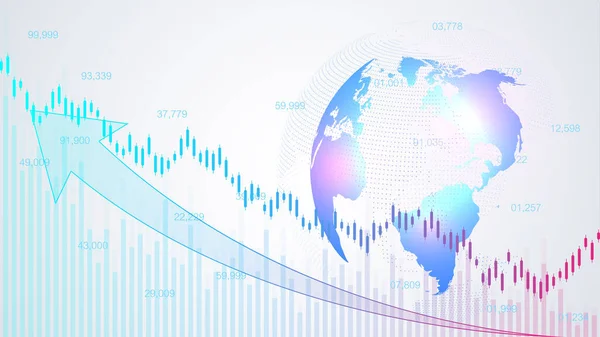
Stock market or forex trading business graph chart for financial investment concept. Business presentation for your design and text. Economy trends, business idea and technology innovation design. — Stock Vector

Stock market or forex trading business graph chart for financial investment concept. Business presentation for your design and text. Economy trends, business idea and technology innovation design. — Vector

Stock market or forex trading business graph chart for financial investment concept. Business presentation for your design and text. Economy trends, business idea and technology innovation design

 — Vector by techdesign07

Same Series:

Stock market or forex trading business graph chart for financial investment concept. Business presentation for your design and text. Economy trends, business idea and technology innovation design
Stock market or forex trading business graph chart for financial investment concept. Business presentation for your design and text. Economy trends, business idea and technology innovation design. — Stock Vector
Stock market or forex trading graph in futuristic concept for financial investment or economic trends business idea. Financial trade concept. Stock market and exchange Candle stick graph chart vector
Stock market or forex trading graph in futuristic concept for financial investment or economic trends business idea. Financial trade concept. Stock market and exchange Candle stick graph chart vector. — Stock Vector
Stock market or forex trading business graph chart for financial investment concept. Business presentation for your design and text. Economy trends, business idea and technology innovation design
Stock market or forex trading business graph chart for financial investment concept. Business presentation for your design and text. Economy trends, business idea and technology innovation design. — Stock Photo, Image
Stock market background or forex trading business graph chart for financial investment concept. Business presentation for your design. Economy trends, business idea and technology innovation design
Stock market background or forex trading business graph chart for financial investment concept. Business presentation for your design. Economy trends, business idea and technology innovation design. — Stock Vector
Stock market or forex trading business graph chart for financial investment concept. Business presentation for your design and text. Economy trends, business idea and technology innovation design
Stock market or forex trading business graph chart for financial investment concept. Business presentation for your design and text. Economy trends, business idea and technology innovation design. — Stock Photo, Image
Stock market or forex trading graph in futuristic concept for financial investment or economic trends business idea. Financial trade concept. Stock market and exchange Candle stick graph chart vector
Stock market or forex trading graph in futuristic concept for financial investment or economic trends business idea. Financial trade concept. Stock market and exchange Candle stick graph chart vector. — Stock Vector
Stock market background or forex trading business graph chart for financial investment concept. Business presentation for your design. Economy trends, business idea and technology innovation design
Stock market background or forex trading business graph chart for financial investment concept. Business presentation for your design. Economy trends, business idea and technology innovation design. — Stock Vector
Stock market or forex trading business graph chart for financial investment concept. Business presentation for your design and text. Economy trends, business idea and technology innovation design
Stock market or forex trading business graph chart for financial investment concept. Business presentation for your design and text. Economy trends, business idea and technology innovation design. — Stock Photo, Image
Stock market background or forex trading business graph chart for financial investment concept. Business presentation for your design. Economy trends, business idea and technology innovation design
Stock market background or forex trading business graph chart for financial investment concept. Business presentation for your design. Economy trends, business idea and technology innovation design. — Stock Vector
Stock market or forex trading business graph chart for financial investment concept. Business presentation for your design and text. Economy trends, business idea and technology innovation design
Stock market or forex trading business graph chart for financial investment concept. Business presentation for your design and text. Economy trends, business idea and technology innovation design. — Stock Vector
Stock market background or forex trading business graph chart for financial investment concept. Business presentation for your design. Economy trends, business idea and technology innovation design
Stock market background or forex trading business graph chart for financial investment concept. Business presentation for your design. Economy trends, business idea and technology innovation design. — Stock Vector
Stock market or forex trading graph in futuristic concept for financial investment or economic trends business idea. Financial trade concept. Stock market and exchange Candle stick graph chart.
Stock Market Forex Trading Graph Futuristic Concept Financial Investment Economic — Stock Photo, Image
Stock market or forex trading business graph chart for financial investment concept. Business presentation for your design and text. Economy trends, business idea and technology innovation design
Stock market or forex trading business graph chart for financial investment concept. Business presentation for your design and text. Economy trends, business idea and technology innovation design. — Stock Photo, Image
Stock market background or forex trading business graph chart for financial investment concept. Business presentation for your design. Economy trends, business idea and technology innovation design
Stock market background or forex trading business graph chart for financial investment concept. Business presentation for your design. Economy trends, business idea and technology innovation design. — Stock Vector

Similar Stock Videos:

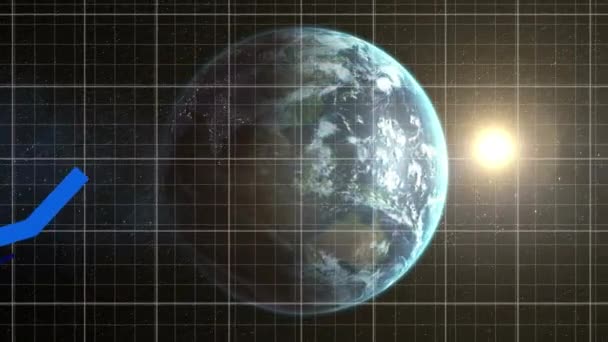
Animation of blue line graphs forming over a rotating globe and sun with a grid on a black background. Global changes concept, digital composite
Animation Blue Line Graphs Forming Rotating Globe Sun Grid Black — Stock Video
A screenshot of a computer. High quality footage
A screenshot of a computer — Stock Video
Animation of financial data processing and statistics recording with globe spinning over grid in the background. Global business and finances concept digitally generated image.
Animation Financial Data Processing Statistics Recording Globe Spinning Grid Background — Stock Video
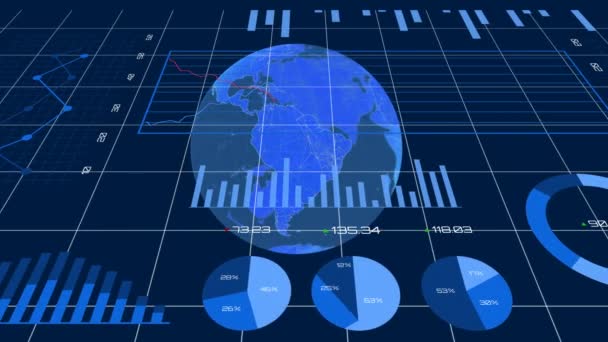
Digital composite of spinning globe against dashboard of financial data on blue background
Digital Composite Spinning Globe Dashboard Financial Data Blue Background — Stock Video
Animation of financial data processing and statistics recording with world map and globe spinning in the background. Global business and finances concept digitally generated image.
Animation Financial Data Processing Statistics Recording World Map Globe Spinning — Stock Video
Digital animation of transparent globe turning around itself with graph and curve on back ground
Digital Animation Transparent Globe Turning Itself Graph Curve Back Ground — Stock Video
Business stock market concept
Stock market concept — Stock Video
Computer generated presentation of global market review, statistical analysis
Computer generated presentation of global market review, statistical analysis — Stock Video
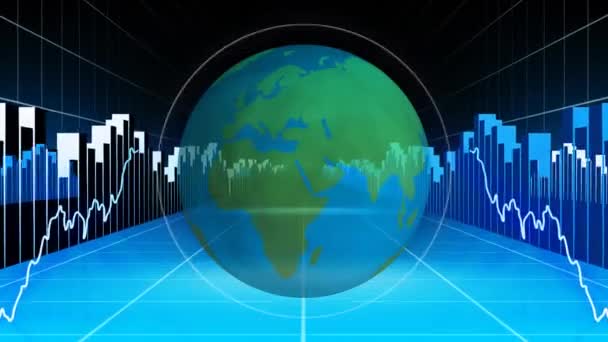
Digitally generated rotating globe with white pulse coming from center while both sides move with a graph and chart. Dark background with square patterns.
Digitally Generated Rotating Globe White Pulse Coming Center While Both — Stock Video
Animation of data processing and diagram on world map on the blue background. Digital online security computer interface concept digitally generated.
Animation Data Processing Diagram World Map Blue Background Digital Online — Stock Video
Electronic chart with Great Britain currency fluctuations after the Brexit vote
Pound falling compared to US dollar, British currency losing its value, crisis — Stock Video
European stock market crash after Great Britain votes to leave the EU. Stock exchange fluctuations
List of European stock indices abruptly falling after Brexit, unstable economy — Stock Video
Animation of financial data processing over globe on black background. global finance, business and digital interface concept digitally generated video.
Animation Financial Data Processing Globe Black Background Global Finance Business — Stock Video
Digital composite of transparent globe turning around itself while bar chart and arrows moving on background
Digital Composite Transparent Globe Turning Itself While Bar Chart Arrows — Stock Video
Blue Business background
Blue Business background — Stock Video
4k HUD graph and bar stats,Stock market business data visualization,financial business chart with diagrams and stock numbers showing profits and losses over time dynamically,flowing counters of numbers.
4k HUD graph and bar stats,Stock market business data visualization. — Stock Video
Animation of financial data processing and statistics recording with green line and globe spinning in the background. Global business and finances concept digitally generated image.
Animation Financial Data Processing Statistics Recording Green Line Globe Spinning — Stock Video

Usage Information

You can use this royalty-free vector image "Stock market or forex trading business graph chart for financial investment concept. Business presentation for your design and text. Economy trends, business idea and technology innovation design." for personal and commercial purposes according to the Standard or Extended License. The Standard License covers most use cases, including advertising, UI designs, and product packaging, and allows up to 500,000 print copies. The Extended License permits all use cases under the Standard License with unlimited print rights and allows you to use the downloaded vector files for merchandise, product resale, or free distribution.

This stock vector image is scalable to any size. You can buy and download it in high resolution up to 5905x3937. Upload Date: Dec 11, 2019