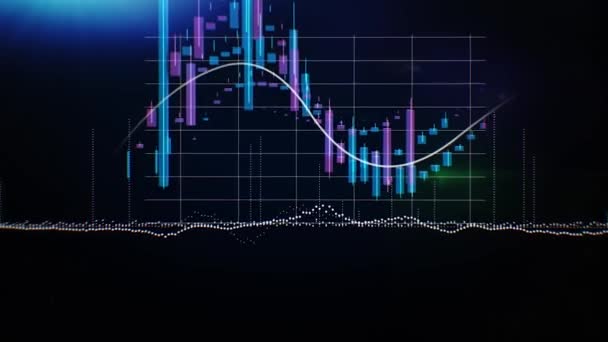
Chart with white line on black background shows minimum and maximum. Close up of dark growing graph 3D animation. Business data market bar graph chart diagram with arrows axis. Grow chart business — Royalty-free Stock Video

Chart with white line on black background shows minimum and maximum. Close up of dark growing graph 3D animation. Business data market bar graph chart diagram with arrows axis. Grow chart business

 — Video by MediaWhalestock

Same Series:

Chart with white line on black background shows minimum and maximum. Close up of dark growing graph 3D animation. Business data market bar graph chart diagram with arrows axis. Grow chart business
Chart with white line on black background shows minimum and maximum. Close up of dark growing graph 3D animation. Business data market bar graph chart diagram with arrows axis. Grow chart business — Stock Video
Abstract mathematical sinusoid function with Y values on black background, exact sciences concept. Green and blue narrow rays and moving math curve.
Abstract mathematical sinusoid function with Y values on black background, exact sciences concept. Animation. Green and blue narrow rays and moving math curve. — Stock Video
Graphs, charts and data. Perfect Flight through Business Network. Looped animation. Growing Business Chart with blue color.
Graphs, charts and data. Perfect Flight through Business Network. Stock. Looped animation. Growing Business Chart with blue color — Stock Video
Abstract animation of money conversion process with different icons connected by lines and dots on grey triangle and black background. Monochrome animation of money converting process
Abstract animation of money conversion process with different icons connected by lines and dots on grey triangle and black background. Monochrome animation of money converting process. — Stock Video
Share price candlestick chart. Animation. Stock market graph and bar chart price display. Financial diagram with candlestick chart. Stock analyzing.
Share price candlestick chart. Animation. Stock market graph and bar chart price display. Financial diagram with candlestick chart. Stock analyzing — Stock Video
Online financial money data encryption using blockchain to protect information. Animation depicting the interconnection of currencies. Global economy concept
Online financial money data encryption using blockchain to protect information. Stock. Animation depicting the interconnection of currencies. Global economy concept. — Stock Video
Dashboard infographic template with modern design of the annual statistics. Important data and digital graphics, finance concept.
Dashboard infographic template with modern design of the annual statistics. Animation. Important data and digital graphics, finance concept. — Stock Video
Program on the computer screen interrupted by system failure message, digital security concept. Signal interference and popups on the monitor.
Program on the computer screen interrupted by system failure message, digital security concept. Animation. Signal interference and popups on the monitor. — Stock Video
Share price candlestick chart. Animation. Stock market graph and bar chart price display. Financial diagram with candlestick chart. Stock analyzing.
Share price candlestick chart. Animation. Stock market graph and bar chart price display. Financial diagram with candlestick chart. Stock analyzing — Stock Video
Business data of the currency rate chart and economics decrease and growth. Infographics with world statistics, global data showing analytical information.
Business data of the currency rate chart and economics decrease and growth. Animation. Infographics with world statistics, global data showing analytical information. — Stock Video
Abstract animation of Litecoin LTC digital currency symbol. Digital cryptocurrency Litecoin sign on black background. video animation.
Abstract animation of Litecoin LTC digital currency symbol. Digital cryptocurrency Litecoin sign on black background. video animation — Stock Video
Program failure warning notifications all over the screen, security alert concept. Computer monitor showing windows with system failure messages with red indicators on background.
Program failure warning notifications all over the screen, security alert concept. Animation. Computer monitor showing windows with system failure messages with red indicators on background. — Stock Video
Tools of technical analysis. Animation. 3D chart of stocks and securities. Currency trading theme. Stock market graph on the screen. Analysing stock market data on a monitor.
Tools of technical analysis. Animation. 3D chart of stocks and securities. Currency trading theme. Stock market graph on the screen. Analysing stock market data on a monitor — Stock Video
Inscriptions system failure appear on the computer screen because of program error. Flickering video signal interference and digital glitch.
Inscriptions system failure appear on the computer screen because of program error. Animation. Flickering video signal interference and digital glitch. — Stock Video
Share price candlestick chart. Animation. Stock market graph and bar chart price display. Financial diagram with candlestick chart. Stock analyzing.
Share price candlestick chart. Animation. Stock market graph and bar chart price display. Financial diagram with candlestick chart. Stock analyzing — Stock Video

Usage Information

You can use this royalty-free video "Chart with white line on black background shows minimum and maximum. Close up of dark growing graph 3D animation. Business data market bar graph chart diagram with arrows axis. Grow chart business" for personal and commercial purposes according to the Standard License. The Standard License covers most use cases, including advertising and UI designs in websites and apps.

You can buy this stock footage and download it in high resolution up to 3840x2160.